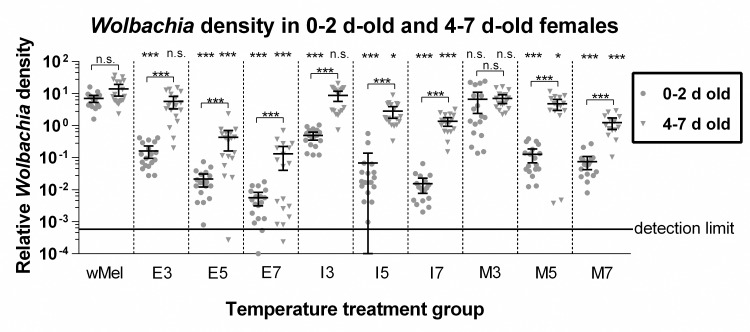
Fig 2. Wolbachia density by treatment group.
Wolbachia densities in 0–2 d-old (circles) and 4–7 d-old (inverted triangles) female wMel A. aegypti exposed to various temperature treatments. “wMel” denotes the wMel-infected A. aegypti controls that were not exposed to high temperatures, and for the other treatment groups the letter represents the stage of heat onset—“E” for embryogenesis, “I” for 1st/2nd instars, and “M” for 3rd/4th instars—and the number represents the number of days the group remained in the high temperature treatment. Wolbachia density was measured by qPCR of the Wolbachia-specific wsp gene and the somatic insect gene Actin5c. Displayed values are relative concentrations of wsp and Actin5c calculated in Q-Gene. The horizontal line at y = 10−3.552 represents the detection limit of Wolbachia by qPCR, which was established by the average Cq values for Wolbachia-free Cairns A. aegypti controls. Bars denote means bounded by their 95% confidence intervals. The lower 95% confidence limit for the 0–2 d-old I5 group (y = −0.009) is not shown because it cannot be represented on the log scale. The significance levels of differences between time points are indicated above brackets and between treatment groups and the wMel controls at the top of the graph as P < 0.05 (*), P < 0.01 (**), P < 0.001 (***). Each point represents an individual mosquito.

