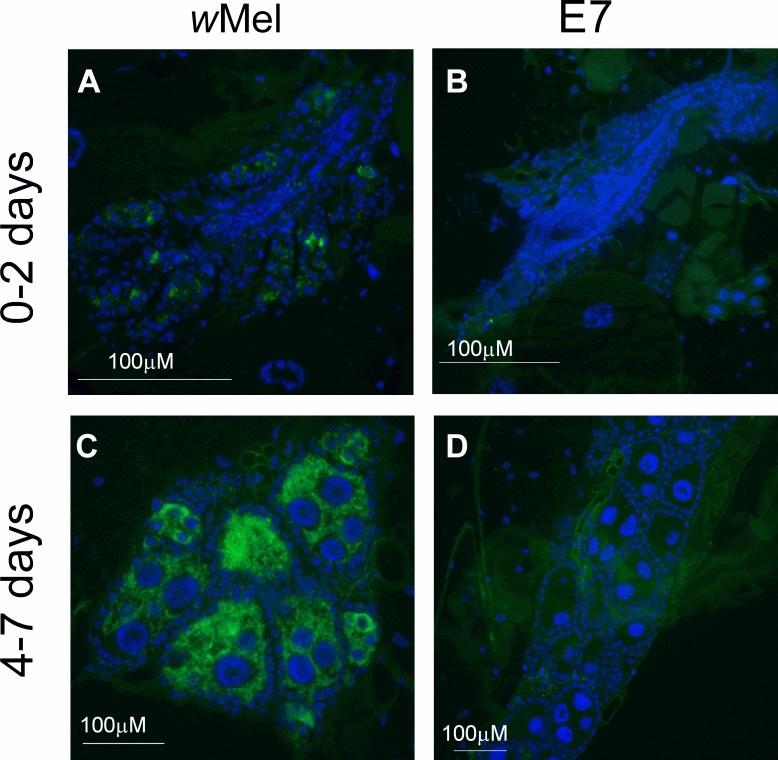
Fig 3. Visualization of Wolbachia in ovaries by FISH.
Ovaries of A. aegypti wMel females emerging from the control (A,C) and E7 (B,D) treatment groups, collected at 0–2 d (A, B) and 4–7 d (C, D) after emergence are shown. Wolbachia were stained with Alexa Fluor 488 (green) and cell nuclei with DAPI (blue).

