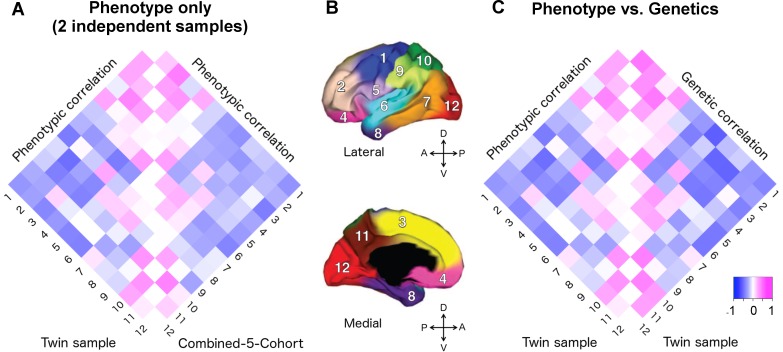
Fig 1. Applying the genetically based cortical parcellations to independent data.
A) The phenotypic correlation matrix of VETSA twin cohort versus the phenotypic correlation matrix of combined-5-cohort (C5C). The Mantel test confirmed that the similarity between them was highly significant (p = 0.0001). B) Cortical brain phenotypes—surface area measures of 12 cortical regions after controlling for total surface area. The cortex was parceled into 12 genetically based regions of maximal shared genetic influence derived from the VETSA sample [16]. 1. motor & premotor; 2. dorsolateral prefrontal; 3. dorsomedial frontal; 4. orbitofrontal; 5. pars opercularis & subcentral; 6. superior temporal; 7. posterolateral temporal; 8. anteromedial temporal; 9. inferior parietal; 10. superior parietal; 11. precuneus; 12. occipital. C) The phenotypic correlation versus the genetic correlations (rg) matrices of VETSA. The correlation of the two matrices was also highly significant (p < 0.0001), suggesting high genetic contributions to the cortical patterning. Correlation coefficients are listed in Supplemental S1 Table and S2 Table.

