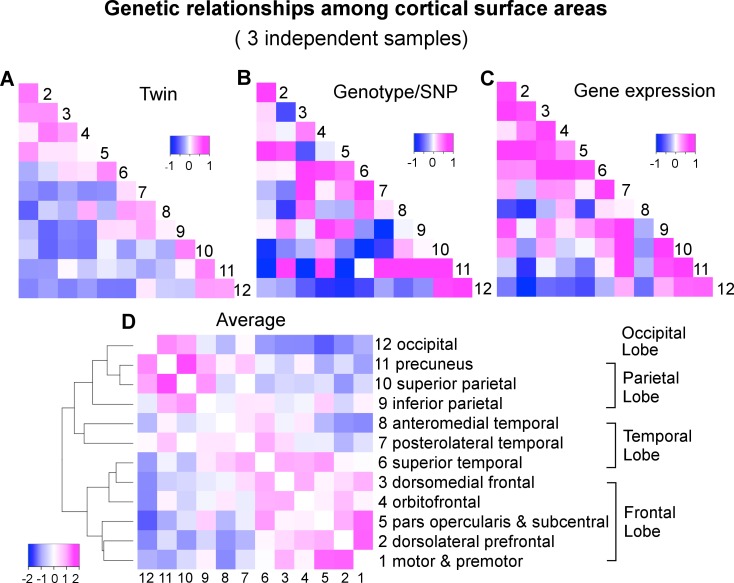
Fig 2. A convergent pattern of genetically mediated relationships among cortical surface areas.
A) Genetic correlations (rg) of VETSA derived by an AE twin model. B) Genetic correlations (rg) of C5C derived by genotype-based GCTA-bivariate model. C) Gene expression or transcriptomic similarities of Allen Human Brain Atlas cohort based on Jaccard coefficient that are scaled to [-1,+1] such that they can be displayed on the same color scale with the correlation coefficients. Subsequent analyses were performed on the original similarity coefficients shown in S4 Table. D) Hierarchical clustering of the genetic correlations between cortical regions averaged over standardized twin rg (A), genotype rg (B), and gene expression similarity (C).

