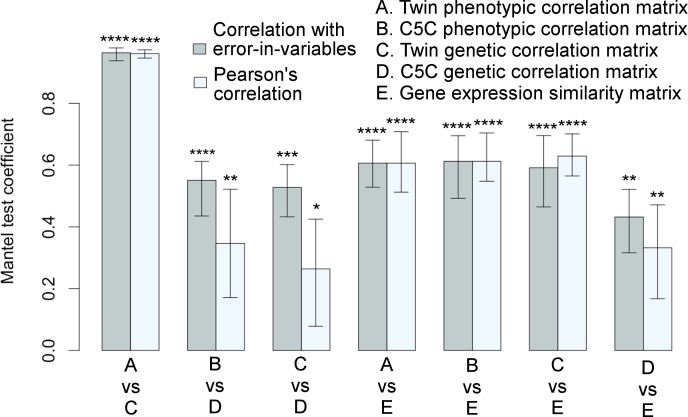
Fig 3. Significant associations among correlation matrices.
Correlation matrices among cortical surface areas derived from a variety of measures are highly consistent with each other as quantified by the Mantel test coefficients with 95% confidence intervals. Each pair of bars represents two correlation methods used in the Mantel test: linear regression with errors-in-both-variables (correlation with EIV) in gray color on the left versus Pearson’s correlation in light-gray color on the right. Variables were standardized in regression analysis. *p≤0.05, **p≤0.01, ***p≤0.001, ****p≤0.0001. Twin refers to VETSA cohort, and twin-based method was used to derive genetic correlations. Genotype-based method was used to derive genetic correlations for ombined-5-cohort. The corresponding matrices are visualized in Figs 1 and 2. See also S1 Fig and S2 Table, S3 Table, and S4 Table.

