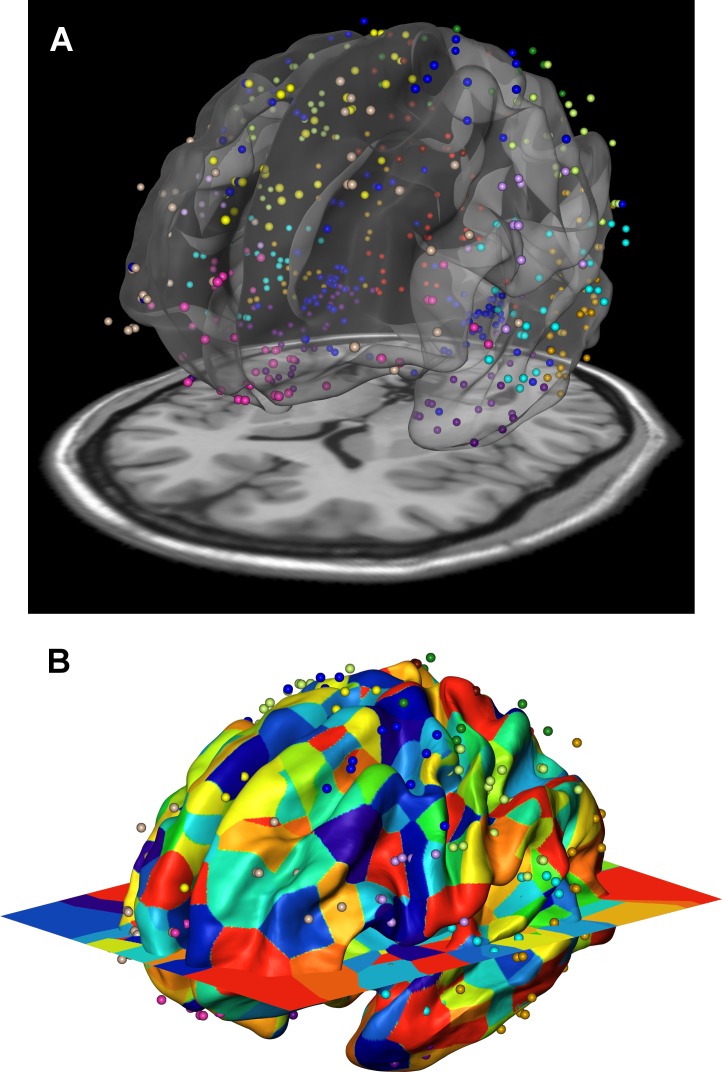
Fig 4. Gene expression data of the Allen Human Brain Atlas were mapped onto the 12 genetically based cortical regions in the MR space.
A) Resulting volume registration between FreeSurfer surface (fsaverage) and Allen brain MNI coordinates displayed as a point cloud, with a slice of the MRI imaging at the bottom (colin27). B) After the volume registration, gene expression data points are mapped to FreeSurfer surface vertices by assigning each surface vertex the gene expression of the closest (Euclidean distance) Allen brain data point using nearest neighbor interpolation. If two vertices have the same closest Allen brain data point, they belong to the same patch and the patch id is displayed as color. Thus, the color patches illustrate the local density of data points. The color patches with similar sizes across the cortex represent an even distribution of Allen brain data points and their surface correspondences. Colors of the dots in both (A) and (B) panels represent cortical regions to which they were assigned, corresponding to the color schemes in Fig 1B.

