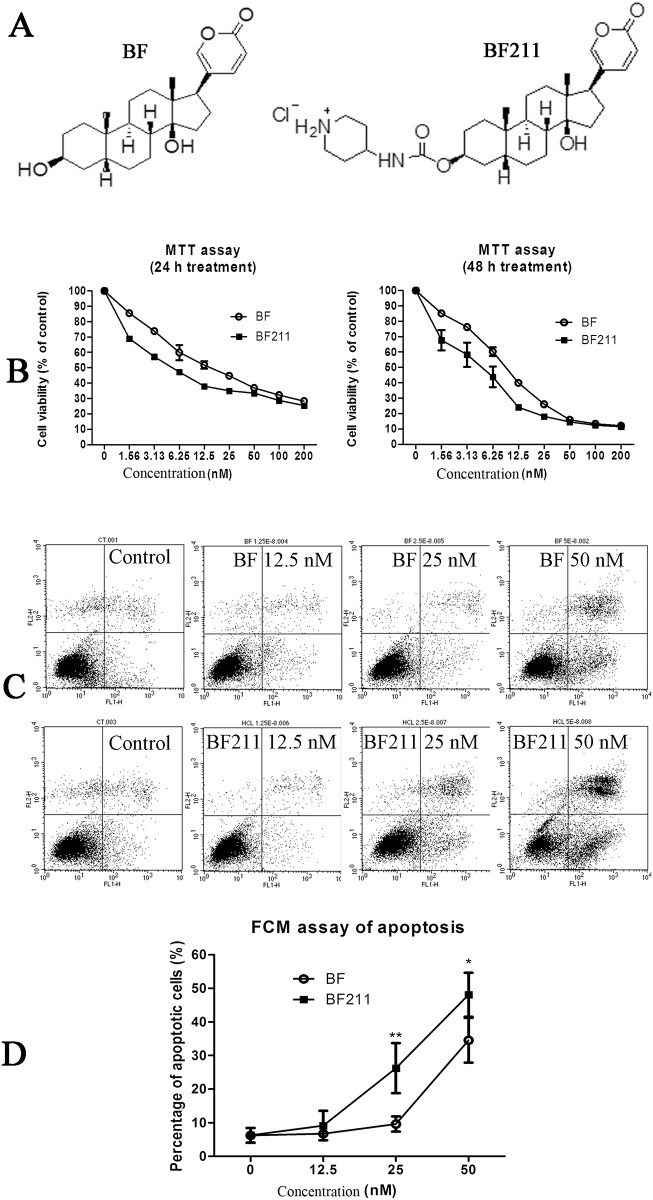
Fig 1. Inhibiting effects of BF and BF211 on the proliferation of A549 cells.
(A) Chemical structures of BF and BF211. (B) The cell viability (MTT assay result) of A549 cells treated with various concentrations of BF or BF211 for 24 or 48 h. The data comprise the statistical results of three independent experiments. (B) A representative of the flow cytometry analysis results of apoptosis induced by 24 h treatment of BF or BF211 at different concentrations. (D) The statistical analysis results of the percentage of apoptotic cells after treatment with BF or BF211 at different concentrations for 24 h. The data comprise the statistical results (n = 3, mean ± SEM) of three independent experiments. *p<0.05, **p<0.01 vs. BF-treated group.

