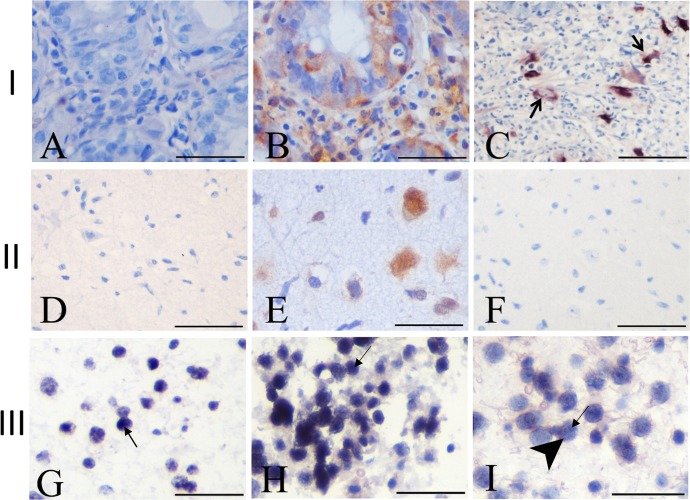
Fig 3. Insitu hybridization in gliomas.
Row I: Infected HCMV colon tissue. (A) No probe. (B) Polyadenylic RNA probe. (C) HCMV 2.7 RNA probe. Row II: Non-tumoral brain. (D) No probe. (E) Polyadenylic RNA probe. (F) HCMV 2.7 RNA probe. Row III: Positive tumor samples. (G) AST I, score 4. (H) ODG II, score 12. (I) AST II, score 6. Arrows indicate nuclear signal in neoplastic cells (dark blue). In I, arrowhead and arrow indicate cytoplasmic and nuclear signal (blue). All samples were counterstained with Eosin. Scale bar = 10μm.

