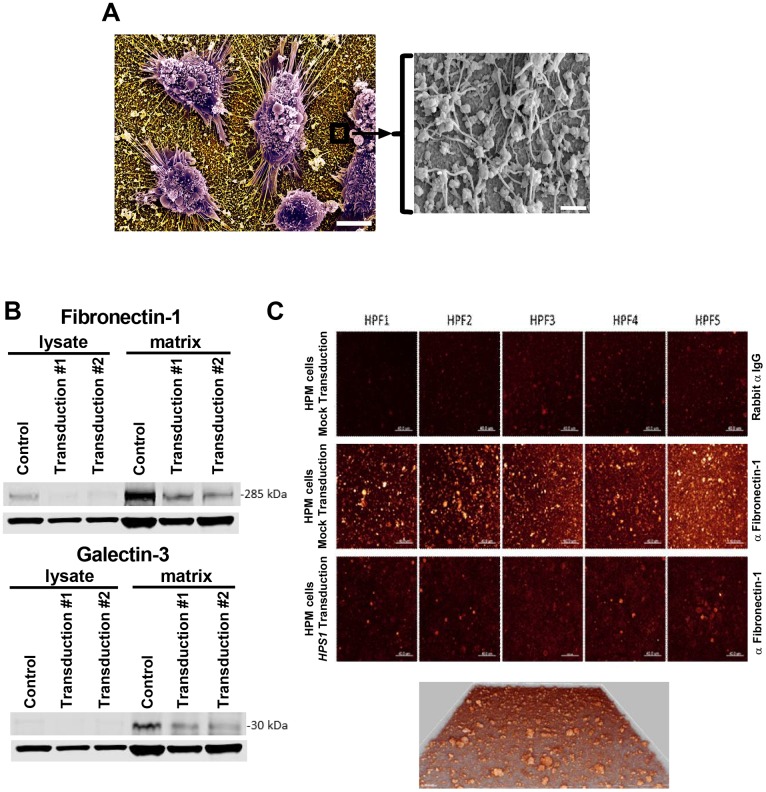
Fig 5. Analysis of extracellular matrix production.
A) Scanning electron micrograph of HPM cells adherent to silicon glass surfaces and producing matrix; scale bar = 5 microns. Window shows higher magnification of surface-bound globular and fibrillar matrix structures; scale bar = 0.5 microns; B) Western blots of non-adherent cell lysates and matrix from mock transduced (control) and two independent transductions of HPM clone #4 with wild type HPS1. Proteins in the matrix reduce following HPS1 transduction when compared with control, but no difference is seen between the two transductions. Lower rows in both blots are β-actin control for cell lysates. A single blot is presented that was probed with antibodies directed against fibronectin-1, galectin-3 and actin. Data are representative of 3 separate experiments; C) Confocal microscopy showing production of fibronectin-1 by mock transduced HPM cells labeled with anti-fibronectin-1 (middle panels) but not rabbit isotype control (upper panels). Significant reduction is noted following transduction with HPS1 (lower panels). Five representative high power fields (HPF) are shown. All HPFs were acquired with identical parameters so that a direct comparison of intensity can be drawn. LUT was adjusted to see the intensity clearer and increased the brightness on all the panels equally. A 3D image of matrix from middle panels in (C) is shown at magnification 630X and shows depth of the matrix.

