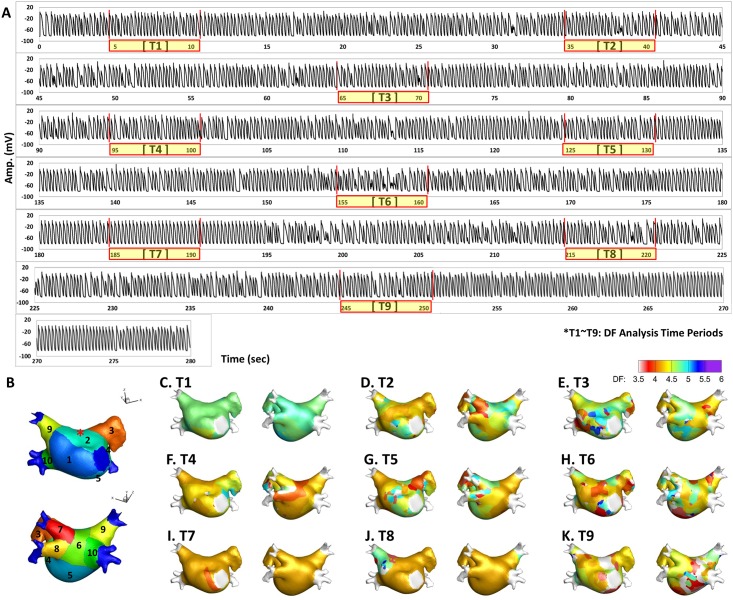
Fig 1.
A. Electrogram (EGM) of action potential (AP) tracing for a total of 280 seconds and nine periods of DF analysis (T1–T9; 6 seconds in each period). B. Ten anatomical sections of the LA geometry. Asterisk: the node where AP tracing in panel A was acquired. C~K. Spatiotemporal changes of DF maps in a representative patient’s LA (T1–T9).

