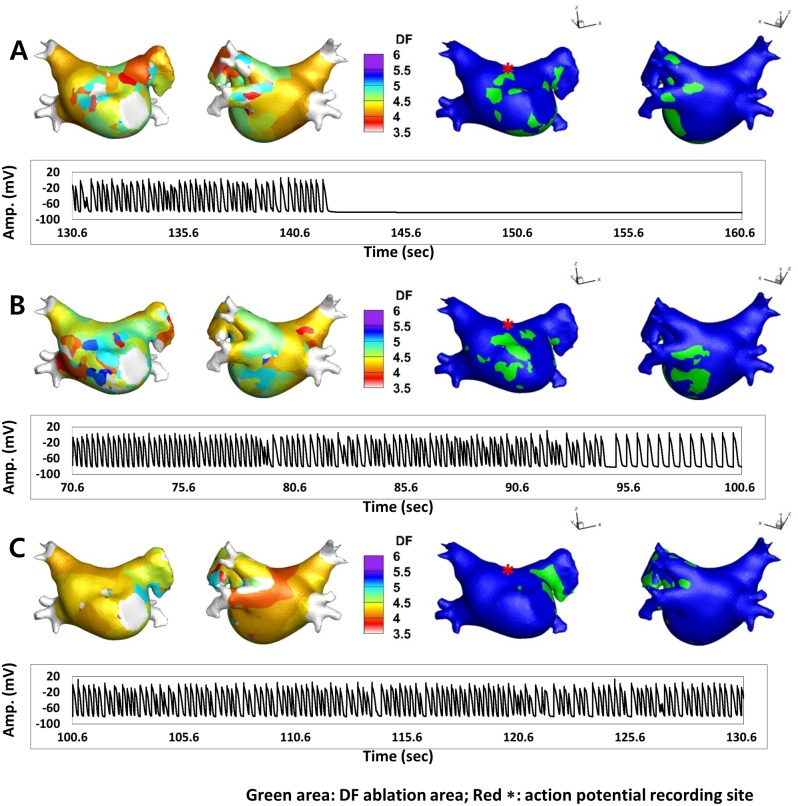
Fig 3. Examples of DF maps (left side maps), the highest 10% DF ablation maps (right side maps, green area) and AP tracings acquired from the LA roof top (red asterisk) after virtual DF ablation.
A. AF was terminated at 142.2 seconds (11.6 seconds after virtual ablation of the high DF area). B. During DF ablation, AF changed into AT at 95.0 seconds (24.4 seconds after virtual ablation). C. The wave dynamics of AF did not change during DF ablation.

