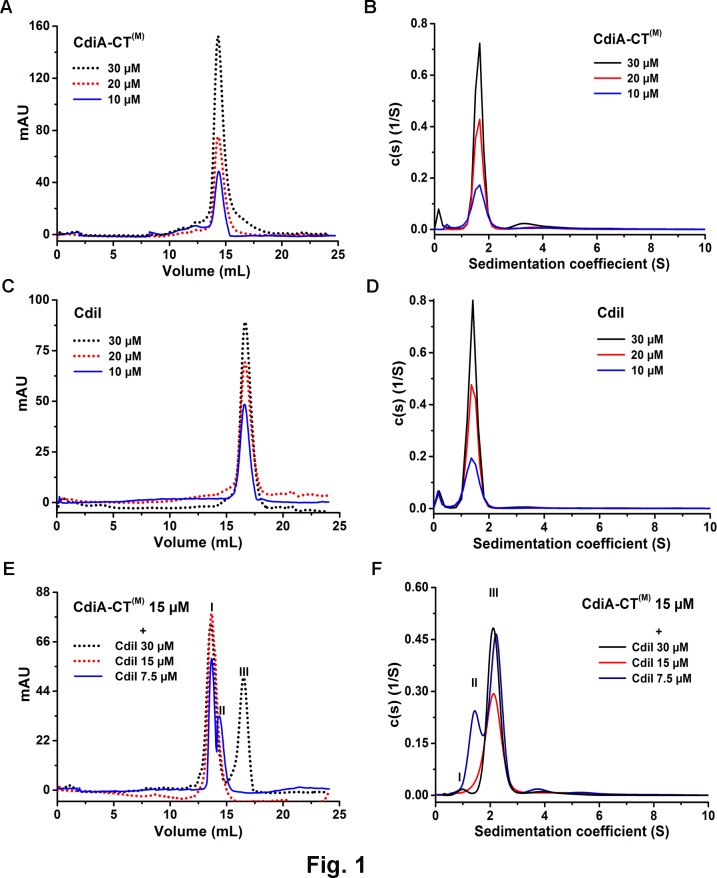
Fig 2. SEC and AUC analyses of the CdiA-CT(M), CdiI and CdiA-CT(M)/CdiI complex.
Sedimentation coefficient distribution c(s) are shown in the right panels and SEC profiles for the same samples are shown in the left panels. (A) and (B) Single predominant peak of CdiA-CT(M) in SEC and AUC data respectively, suggest monodisperse samples. (C) and (D) CdiI also shows a predominant monomeric peak in both SEC and AUC respectively and no significant concentration dependent oligomerization was observed. (E) SEC analysis of CdiA-CT(M)/CdiI complex. Peaks I, II and III corresponds to CdiA-CT(M)/CdiI complex, CdiA-CT(M) and CdiI respectively. Single major peak was observed when CdiA-CT(M) and CdiI were mixed in 1:1 molar ratio. (F) AUC data suggests 1:1 stoichiometric complex of CdiA-CT(M)/CdiI (peak III). Under sub-stoichiometric conditions peak I correspond to excess CdiI and peak II corresponds to excess CdiA-CT(M).

