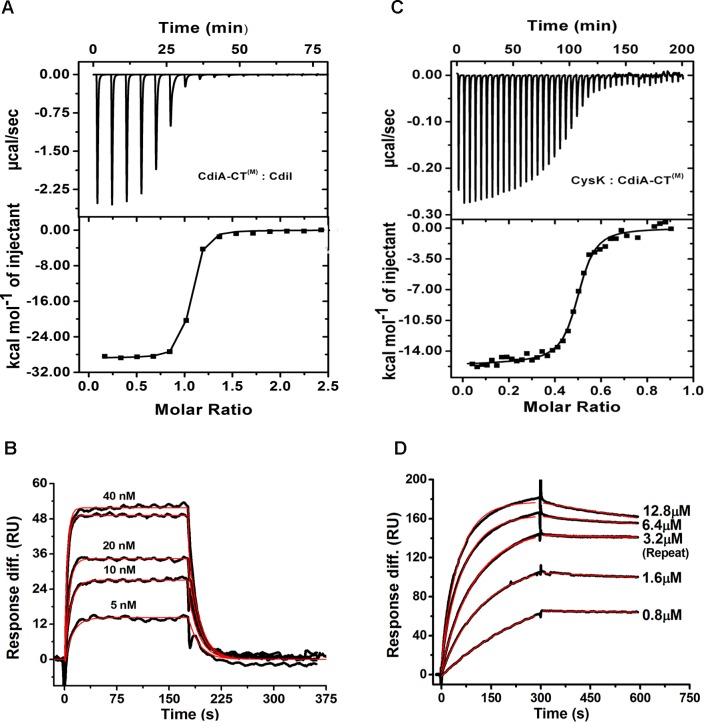
Fig 4. ITC and SPR data showing kinetics and thermodynamic parameters of protein-protein interactions.
Representative isothermal calorimetric titration curve of (A) CdiA-CT(M)/CdiI (C) CdiA-CT(M) and CysK. The top panel shows the calorimetric titration and bottom panel shows derived binding isotherm plotted versus the molar ratio of the titrant. The solid line in the lower panel is the best fit to the data using the nonlinear least squares regression algorithm. SPR analysis of binding of (B) CdiA-CT(M)/CdiI, (D) CdiA-CT(M)/CysK. Both raw sensograms (black lines) and fitted curves (red lines) are shown in the figure. These sensograms are representative of three sets of experiments that we carried out using four to five different concentrations of the analyte. In each figure, one representative sensogram for repeat run is also shown. (CdiA-CT(M)/CysK) complex. ITC data suggest that two monomers of CdiA-CT(M) bind with one dimer of CysK.

