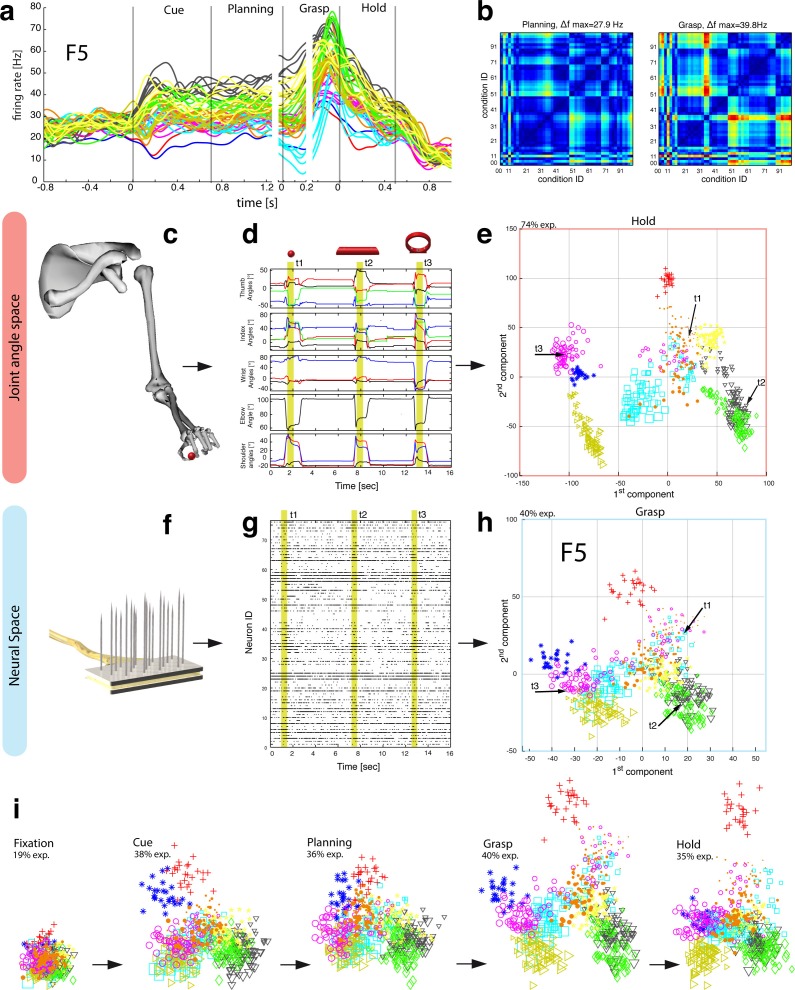
Figure 4. Motor planning and execution in F5.
(a) Example neuron of F5, responding to all 50 task conditions (colour code as in Figure 1b). (b) Modulation depth plots (as in Figure 2b) in the planning and grasp epoch. (c) Recorded kinematics was used to drive a monkey-specific musculoskeletal model that allowed extracting 27 DOF. (d) A selection of DOFs is presented for three sequential grips: thumb and index finger, wrist, elbow, and shoulder. (e) PCA performed on the J-space during the hold epoch allowed visualizing the grip types of all conditions and trials of one recording session (showing 1st and 2nd PCA component). (f–g) Raster plot shows the spiking activity of F5-neurons recorded from a single FMA (F5-ventral). (h) Mean firing rates during the grasp epoch (N-space) were transformed with CDA to reduce and visualize the multidimensional representation of the complete F5 population (N = 119, simultaneously recorded). In d,g, example trials t1, t2 and t3 are highlighted in yellow (hold epoch in d, grasp epoch in g) and marked with arrows in e,h. (i) Neuronal state space evolution shows the course of the task determined by the CDA. e,h and i: For visual comparison the N-space was aligned to the J-space using PCRA; Symbols and colours as in Figure 1b, symbol size corresponds to object size.

