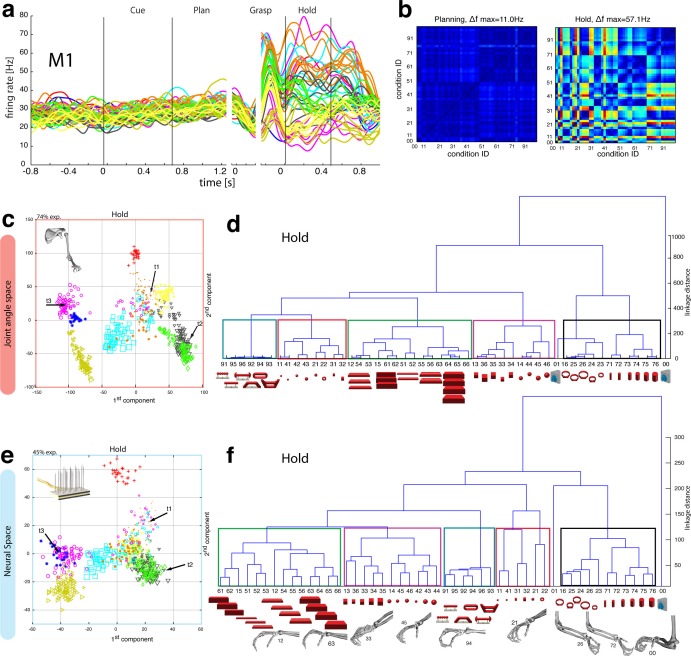
Figure 6. Motor execution in M1.
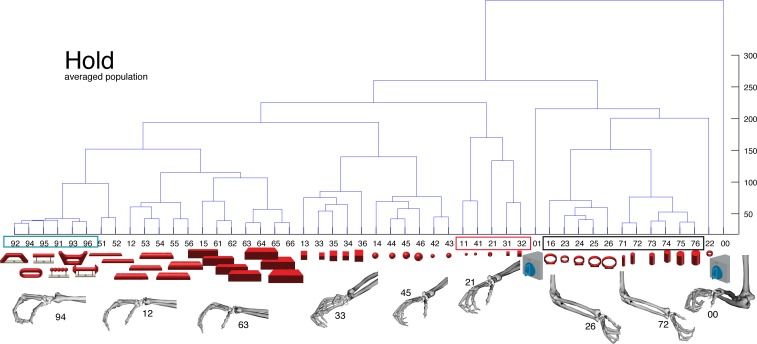
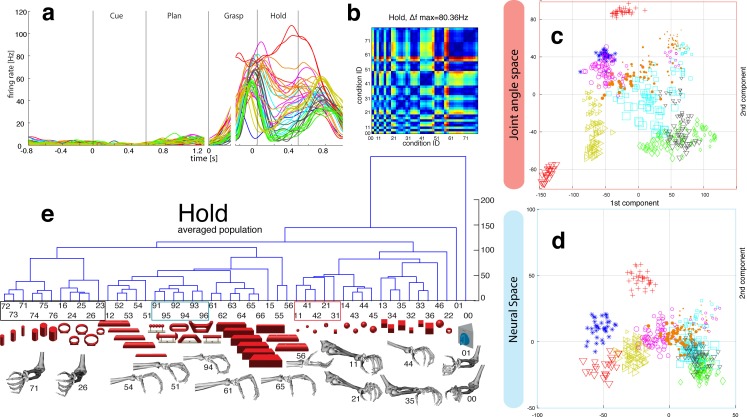
(a) Example neuron of M1 in monkey M, curves show firing rates separately for all 50 task conditions (colour code as in Figure 1b). (b) Modulation depth plots (as in Figure 4b) for the planning and hold epoch of the example neuron in a. (c) Population activity from the reduced and (d) the complete kinematic space (J-space) is compared to (e) the reduced and (f) the complete neural population space (N-space) of M1 during the hold epoch of the task (N = 151, simultaneously recorded). In e, N-space was aligned to J-space with PCRA; symbols and colours as in Figure 1b; symbol size corresponds to object size. Arrows t1-t3 highlight the example trials of Figure 4d,g. See Figure 6—figure supplement 1–2 for the averaged population results of animal M and animal Z, respectively.


