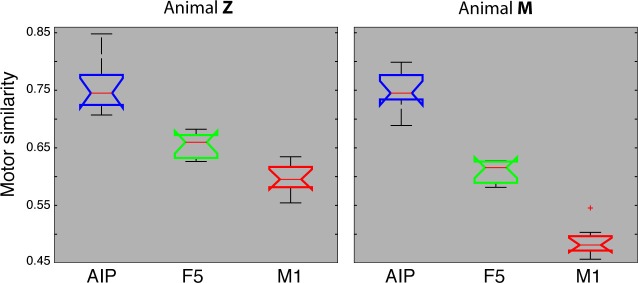
Figure 7. Motor similarity measure.
Boxplots illustrating similarity between the population coding of J-space and N-space during the hold epoch of the task, as provided by the PCRA analysis. Left: results in AIP, F5, and M1 across all 10 recording sessions for monkey Z. Right: same for monkey M. Red horizontal lines indicate median value, boxes show lower and upper quartile of data (25%–75%), and whiskers indicate maximum and minimal values.

