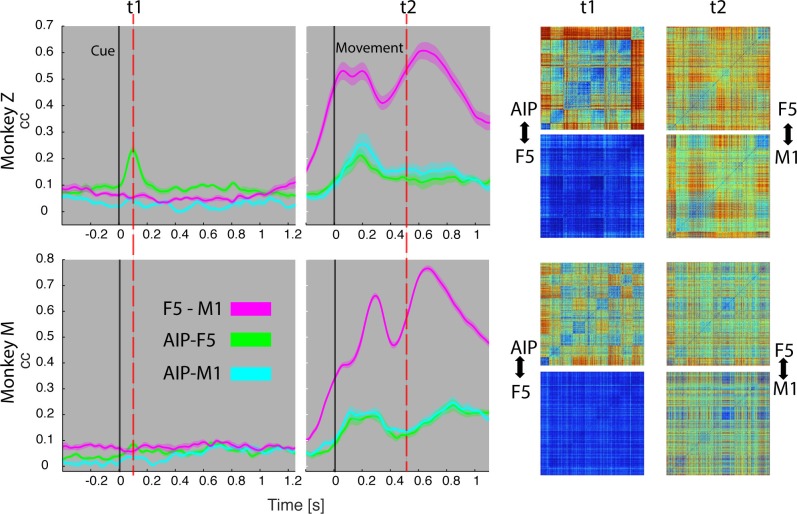
Figure 8. Temporal feature correlation between areas.
The distance (in firing rate) between all possible trial-pairs was computed separately in the N-space of area AIP, F5 and M1. The resulting distance maps thus represent the neuronal modulations of a population (e.g. AIP) for a specific time t. (Right) Example maps show the neural modulation patterns at key times t1 (object presentation) and t2 (during hold). Warm colours: long neural distances, cool colours: short neural distances. (Left) Correlating the neuronal patterns across time (Spearman’s r) allowed visualizing the similarity between the areas for animal Z (top row) and animal M (bottom row). For computation, spiking activity was aligned to the beginning of the cue and grasping onset. For an animation of the feature code correlation see Video 5.

