. 2016 Jul 26;5:e13810. doi: 10.7554/eLife.13810

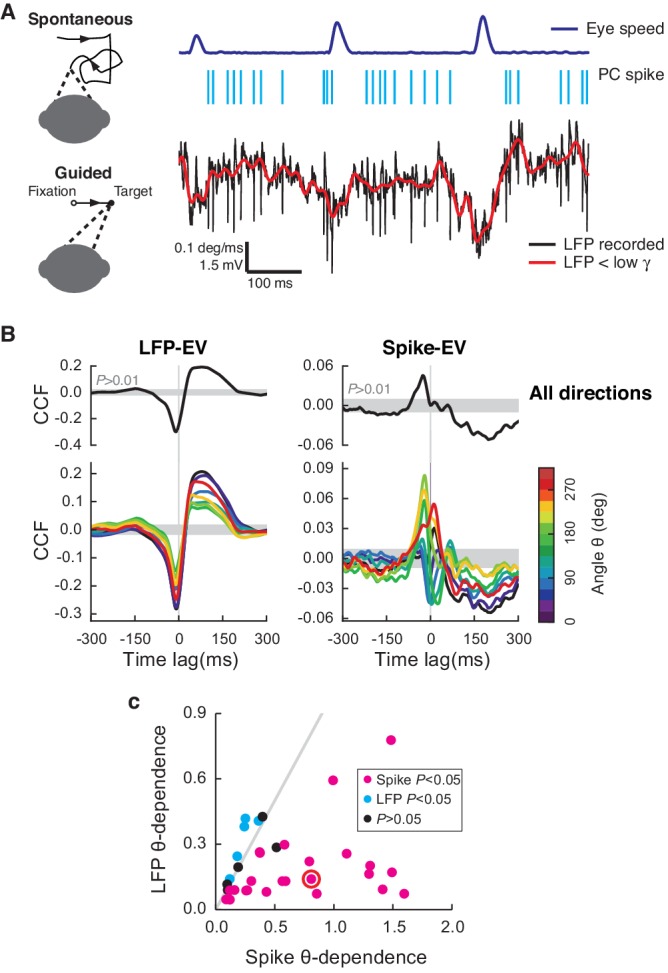
Figure 1. Cerebellar LFP and PC spikes correlate differently with saccadic eye movements.

(A) Left: Schematics of eye motion tasks. Right: Simultaneously recorded eye speed, PC spike train, and LFP. Both the recorded (black) and filtered LFP below the low-γ frequency (red) are shown, but only the latter was analyzed. (B) CCFLFP-EV and CCFSpike-EV computed with EV (Top) and eye speed in the direction with the angle θ (Bottom). Shaded regions represent the 99% confidence interval. Data are normalized as described in the Materials and methods and plotted as mean ± SEM. (C) θ-dependent variability of CCFLFP-EV (x-axis) versus CCFSpike-EV (y-axis). CCFSpike-EV varied significantly more (p<0.05, t-test) than CCFLFP-EV in 74% (= 25; magenta), and less in 15% (= 5; cyan) of all recordings. No difference was found in the rest (= 4; black). Error bars are omitted for clarity. The gray line represents equal variability. The red circle denotes data in A and B.
DOI: http://dx.doi.org/10.7554/eLife.13810.003

Figure 1.

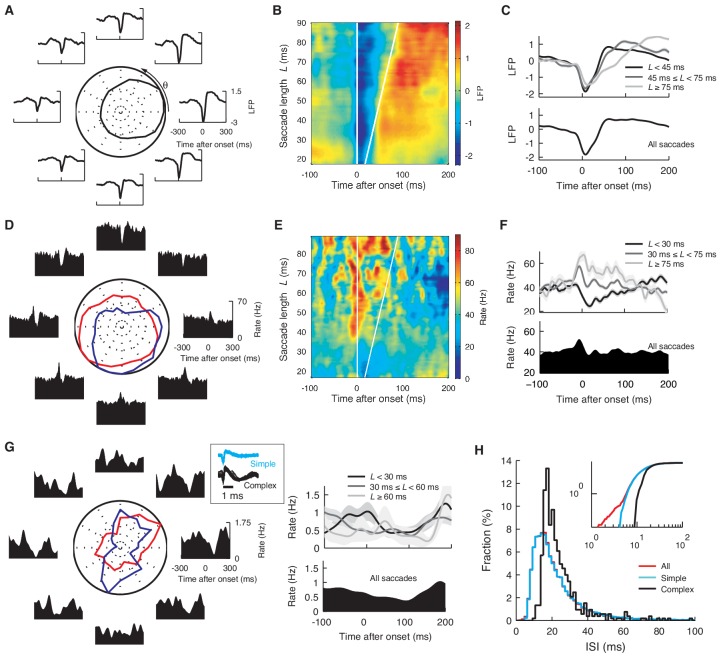
Figure 1—figure supplement 1. Saccade angle and duration dependence of the onset-triggered average LFP, simple and complex spikes.

Figure 1—figure supplement 1.

(A) Onset-triggered average LFP with different saccade angle θ and, (BL. Each data point at θ or L represents the average over [θ − 45º, θ + 45º] or [L − 4 ms, + 4 ms]. The LFP was normalized by its standard deviation. In (A) the curve in the center represents the normalized peak-to-peak amplitude of the average LFP. In (B) white lines mark the saccade beginning and end, respectively. (C) The average LFP for the different saccade lengths (top), and for all the saccades (bottom). (D, E, F) The same plots as (AC) for the firing rate. In (D) red and blue lines represent normalized maximal and minimal firing rates, respectively. The rate was computed with a Gaussian smoothing kernel of σ = 10 ms. Note that waveforms in (A) and (D) are similar to CCFs in Figure 1B. (G) Firing rate of complex spikes, computed with σ = 25 ms, varying with θ (left) and L (right). The boxed insert shows spike waveforms. (H) Histograms of ISIs after simple (cyan), complex (black), and all spikes (red). Note that the simple and all-spike cases are nearly identical while the complex spike case is shifted, reflecting pauses after complex spikes. Cumulative distributions (inset) show that the all-spike case has a small number of short ISIs < 5 ms, caused by complex spikes that immediately follow simple spikes. Data are mean ± SEM. The data are the same as in Figure 1A,B.