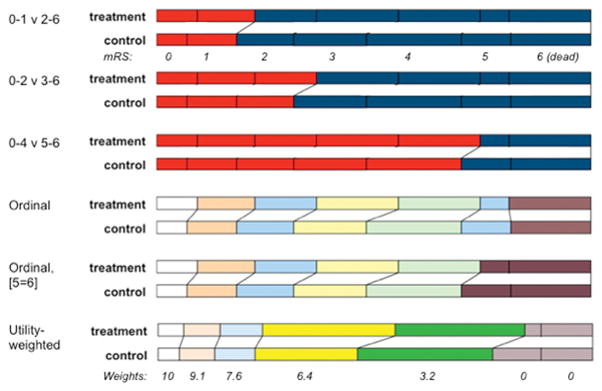
Figure. Schematic illustration of analysis approaches to modified Rankin scale (mRS) in stroke trials.
Each pair of stacked bars represents the same trial outcome, with proportion of patients achieving best outcome (mRS 0) on the left and worst outcome (death, mRS 6) to the right. The top 3 sets illustrate dichotomisation approaches, in which mRS categories are grouped for analysis purposes, ie red is compared to blue. The lower 3 sets show methods of ordinal analysis, where all, or most, categories are considered independently. The 6th set illustrates the impact of applying a utility-weighted approach to the mRS strata for the same trial.

