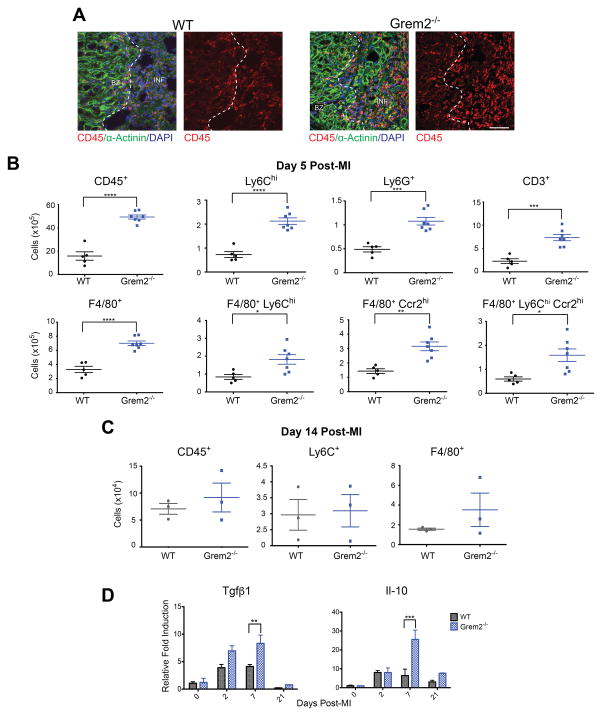
Figure 3. Loss of Grem2 increases the magnitude but not the duration of the inflammatory response after MI.
(A) IF analysis at day 5 post-MI illustrates that Grem2−/− mice have increased levels of infiltrating leukocytes marked by CD45 (red) compared to WTs. α-Actinin (green) staining marks cardiomyocytes. DAPI marks cellular nuclei. Scale bars 50 μm. BZ=border zone, INF=infarct. (B) Flow cytometry analysis of single cell suspensions of non- cardiomyocyte cells isolated from whole hearts and analyzed using antibodies recognizing CD45, Ly6C, Ly6G, CD3, F4/80, and Ccr2 shows increased infiltration of inflammatory cells at day 5 post-MI in Grem2−/− mice compared to WTs. *P<0.05; **P<0.01; *** P < 0.001; ****P<0.0001. Student’s two-tailed unpaired t-test. WT N=5, Grem2−/− N=7. Bars represent means ± SEM. (C) Flow cytometry analysis of single cell suspensions of non- cardiomyocyte cells isolated from whole hearts of WT and Grem2−/− mice shows no significant differences of CD45+, Ly6C+ and F4/80+ cells between the two groups at day 14 post-MI. N=3. (D) qPCR analysis of whole heart RNA samples isolated from WT and Grem2−/− mice at days 0, 2, 7 and 21 post-MI shows higher induction levels of Tgfβ1 and Il-10 in Grem2−/− hearts compared to WTs. ** P < 0.01; *** P < 0.001. Two-way ANOVA with Bonferroni multiple comparisons test. N=3 per group for all time points. All data are means ± SEM. Abbreviations: Il-10: Interleukin 10.

