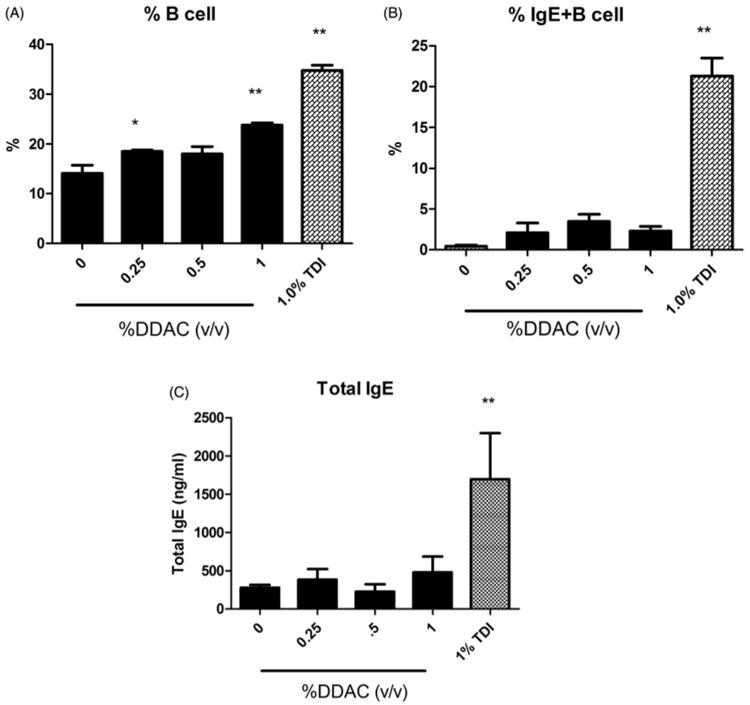
Figure 3.

Local and systemic IgE levels following dermal DDAC exposure. Percentages of (A) B-cells and (B) IgE+ B-cells among total lymphocytes in the DLN and (C) total serum IgE (C) on Day 10 following 4 days of DDAC application. Bars represent mean (± SE) of five mice per group.
