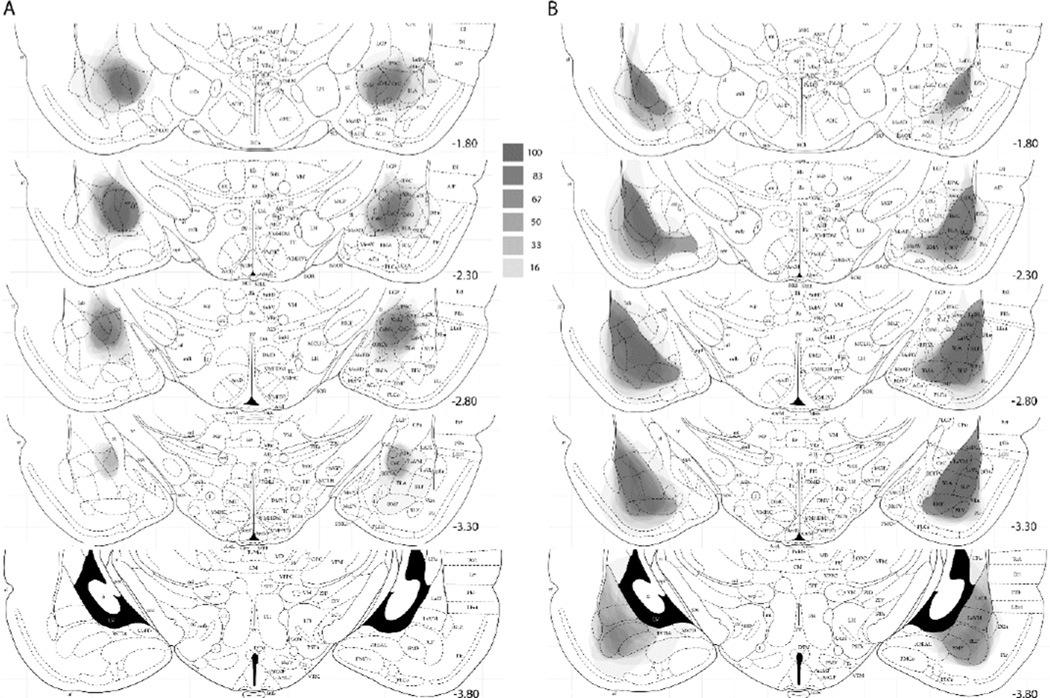
Figure 1.
Amygdala lesions in experiment 1. (A) Extent of lesions at 5 anterio-posterior planes in the rats that received ibotenate lesions of amygdala central nucleus (CeA). (B) Extent of lesions at 5 anterio-posterior planes in the rats that received NMDA lesions of the basolateral amygdala (BLA). In both A and B, each lesion is represented; the darker an area, the more lesions included that area (see text for details). The scale between panels A and B relates the shades of gray in a location to the percentage of lesioned rats with damage to that location. The lesions are drawn on sections from The Rat Brain in Stereotaxic Coordinates (4th ed.), pp. 26, 29, 31, 33 and 35, by G. Paxinos & C. Watson, 1998, New York, NY: Academic Press. Copyright 1998 by Elsevier Academic Press. Adapted with permission. The numbers to the right of each section indicate mm posterior (−) to bregma.

