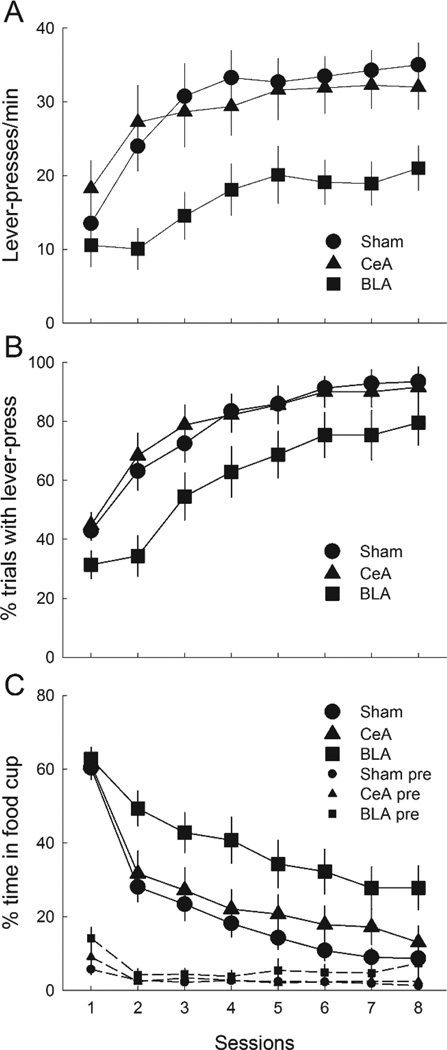
Figure 7.
Mean ± s.em. responding to the compound of lever presentation + previously-reinforced auditory cue in the autoshaping phase of Experiment 3. Panels A, B, and C show lever press rates, percentage of trials on which a lever-press occurred, and percentage of time spent in the food cup during the lever + auditory cue compounds, respectively. Panel C also shops the percentage of time spent in the food cup in the 10-s periods prior to lever presentations (pre). CeA = rats with lesions of amygdala central nucleus; BLA = rats with lesions of basolateral amygdala.

