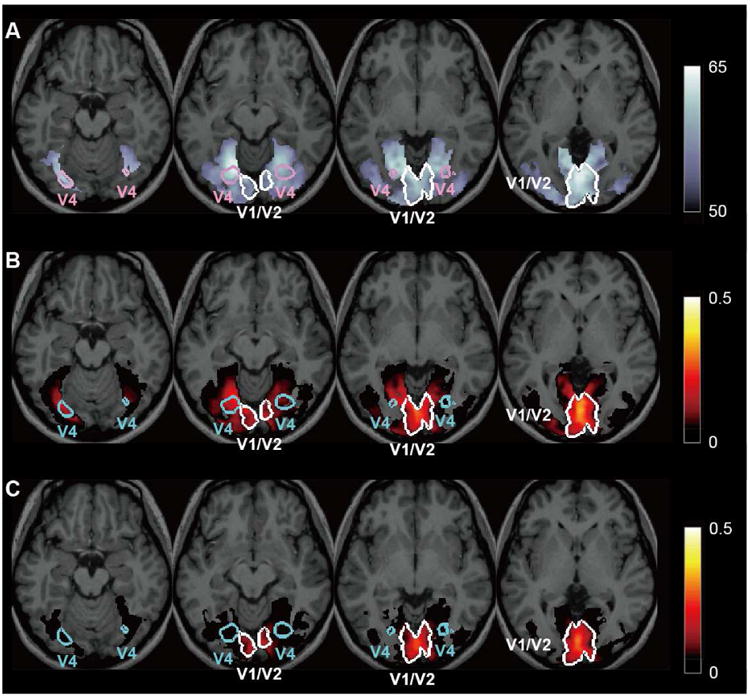
Figure 4. Accuracy of the color classifier and predictability of the red likelihood in V1/V2 using a searchlight analysis [14]. Color coded voxels correspond to P<0.05.

(A) Distribution map of the color classifier accuracy during the color classifier construction stage. The accuracy was computed by moving a sphere ROI across the whole brain. The classifier has the ability to extract information for the red likelihood in both V1/V2 and ventral areas including V4. The color scale bar indicates the accuracy (%).
(B) Distribution map of the predictability of the red likelihood of V1/V2 during the color classifier construction stage. The predictability was the highest in V1/V2 and to a moderate degree in ventral areas including V4. The color scale bar indicates a coefficient of determination between the V1/V2 red likelihood predicted by BOLD-signal patterns within an ROI and the actual V1/V2 red likelihood (based on the V1/V2 BOLD-signal patterns) in the searchlight analysis. See Supplemental Experimental Procedures for technical details.
(C) Distribution map of the predictability of the red likelihood of V1/V2 during the A-DecNef training stage. Not much significant predictability was found outside V1/V2. The color scale bar indicates a coefficient of determination, as in (B). See Supplemental Experimental Procedures for technical details.
See also Figure S3.
