
Figure 6.
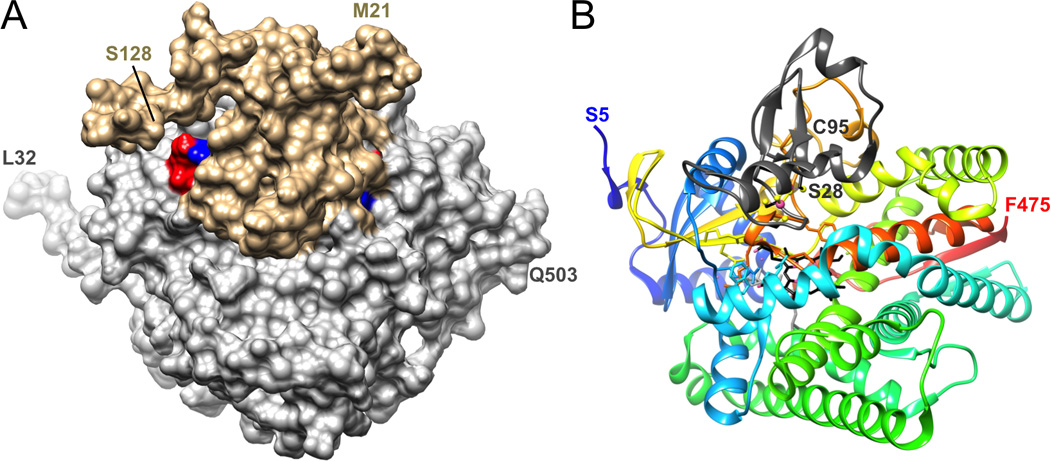
Three-dimensional structures of P450 complexes. (A) Surface representation of the complex between human P450 17A1 (gray) and cytochrome b5 (beige) based on cross-linking and mass spectrometric analysis [106]. The model was generated with the program HADDOCK [108], using the X-ray coordinates of human 17A1 (PDB 3RUK) [100] and NMR coordinates of human b5 (PDB 2I96). Two salt bridges identified by XLMS are highlighted in blue (lysine) and red (glutamate), and N- and C-terminal residues of both proteins are labeled. (B) Crystal structure of the complex between P450 11A1 and adrenodoxin (Adx, PDB 3N9Y) [107]. P450 11A1 is shown in cartoon mode with rainbow coloring from blue (N-terminus) to red (C-terminus), adrenodoxin is depicted as a dark gray ribbon (only a portion of Adx, residues Ser-28 to Cys-95, was visible in the crystal structure), carbon atoms of heme and cholesterol are colored in black and gray, respectively, and iron (P450 Fe3+ and Adx [2Fe-2S] cluster) and sulfur atoms are highlighted as pink and yellow spheres, respectively. The complexes depicted in the two panels are shown in similar orientations.