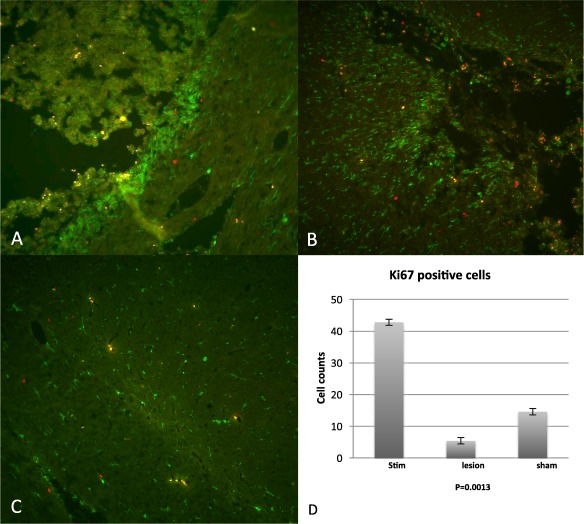
Figure 4.

a,b. Ki67 (red) and Iba1 (green) labeled cells in two representative HF‐STN animals. Iba1 positive cells immediately surrounding the electrode site demonstrate amoeboid morphology, whereas immediately adjacent to the site of stimulation, cells demonstrate normal distribution and ramified morphology. c. Bottom panel shows normal, ramified Iba1 microglia in the contralateral STN from HFS animals. d. Graph representing the quantification of Ki67 positive cells in the STN in stimulated animals vs. microlesion and sham animals, clearly demonstrating a significant increase in Ki67 positive cells in the stimulated group alone, p = 0.0013.
