
Figure 5.
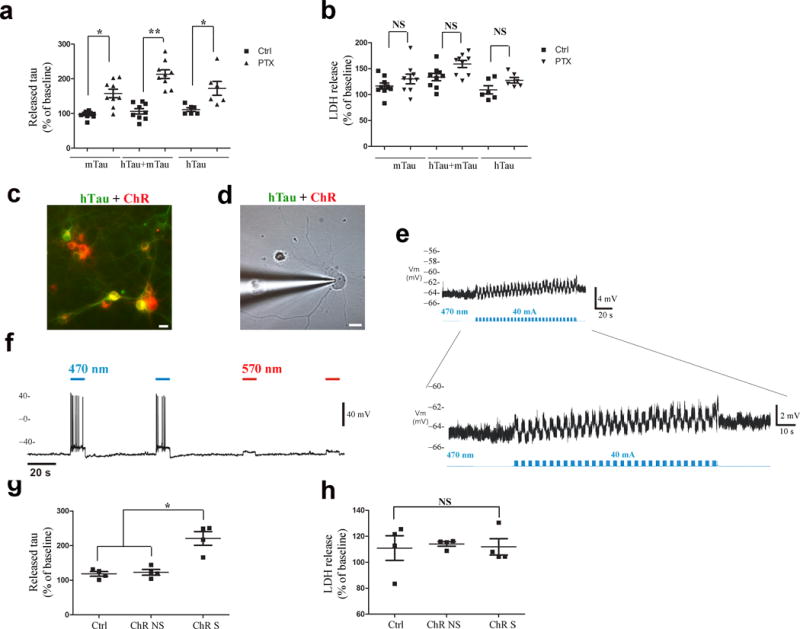
Tau release is enhanced by stimulating neuronal activity. (a) Sandwich ELISA showed that tau is released into the media from cultured cells (mTau, n = 9 cultures per treatment group; hTau + mTau, n = 9 cultures per treatment group; hTau, human and iPSC neurons, n = 6 cultures per treatment group), when treated with picrotoxin for 30 min. Raw data was normalized to baseline levels for each cell population, and plotted as the percent change. A significant difference was observed between treated and untreated groups for each model: mTau t(9.167) = −4.75, Bonferroni adjusted P =0.003; hTau + mTau t(16) = −7.25, adjusted P < 0.0001; hTau t(10) = −2.95, adjusted P = 0.044. (b) No significant difference was observed between treated and untreated groups in LDH release. Group n’s were as above. P values from adjusted t-tests = 0.73, 0.061, and 0.233. (c) Transduced neurons co-express both tau (green) and ChR2 (red). (d) Tau and ChR2-expressing neuron was patch-recorded and (e) exhibited ~5 mV depolarization of membrane potential (RMP) with light stimulation at 30 Hz. (f) Light at 470 nm, but not 570 nm caused a 12mV depolarization in ChR2-cells. (g) Significant difference in tau released after stimulation (30 min) (n = 4 cultures per condition) (Kruskal-Wallis χ2(2) = 7.42, P = 0.024) with significantly higher tau in stimulated cells compared to non-stimulated (adjusted P = 0.036) and control neurons (adjusted P = 0.021). (h) LDH release measured before and after treatment did not differ significantly χ2(2) = 0.731, P = 0.694 (n = 4 cultures per condition).