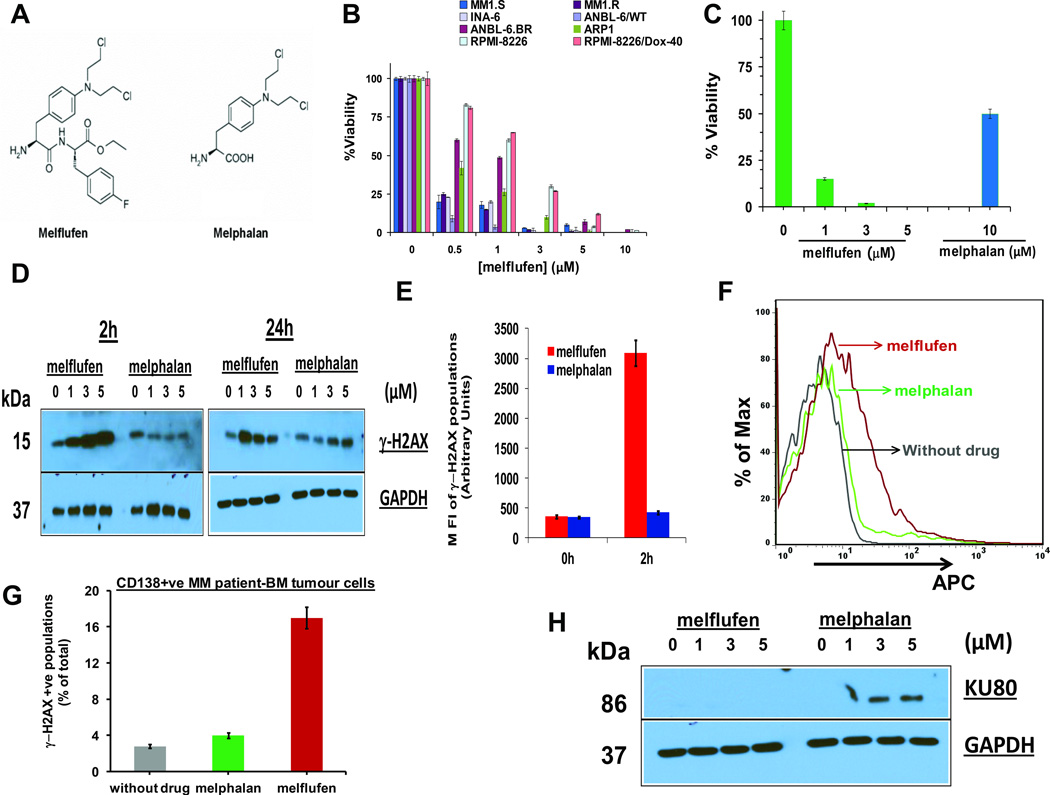
Figure 1. Anti-MM activity of melflufen is associated with dose- and time- dependent rapid phosphorylation of H2AX.
(A) Structure of Melphalan Flufenamide (left panel; Melflufen) and Melphalan (right panel). (B) MM cell lines were treated with indicated doses of melflufen for 24h, and cytotoxicity was assessed using MTT assay (n = 3, mean ± SD; p < 0.005 for all cell lines). (C) MM.1S cells were treated with melflufen or melphalan at the indicated concentrations for 48h, and cytotoxicity was measured by MTT assay (n = 3, mean ± SD; p < 0.005). (D) MM.1S cells were treated with equimolar concentrations of melflufen or melphalan for 2h and 24h; protein lysates were subjected to immunoblot analysis using antibodies specific against γ-H2AX and GAPDH. (E) MM.1S cells were treated with equimolar melflufen to melphalan (1 µM) concentrations for 2h. Cells were fixed and stained with Alexa Fluor 647 conjugated anti-H2AX (pS139) antibody, and then subjected to FACS analysis. Bar Graph: Quantification of γ-H2AX populations (mean ± SD; p< 0.05; n=3). (F) MM patient cells (CD138+, no of samples = 3) were first treated with melflufen (5 µM) or melphalan (10 µM) for 1h and then washed with PBS to remove drugs. Cells were fixed and stained with Alexa Fluor 647 conjugated anti-H2AX (pS139) antibody, and subjected to FACS analysis. (G) Bar Graph: Quantification of γ-H2AX-positive cell population shown in Figure 1F (mean ± SD; p< 0.05; n=3). (H) MM.1S cells were treated with indicated concentrations of melflufen or melphalan for 24h; protein lysates were subjected to immunoblot analysis using Ku80 and GAPDH Abs.

