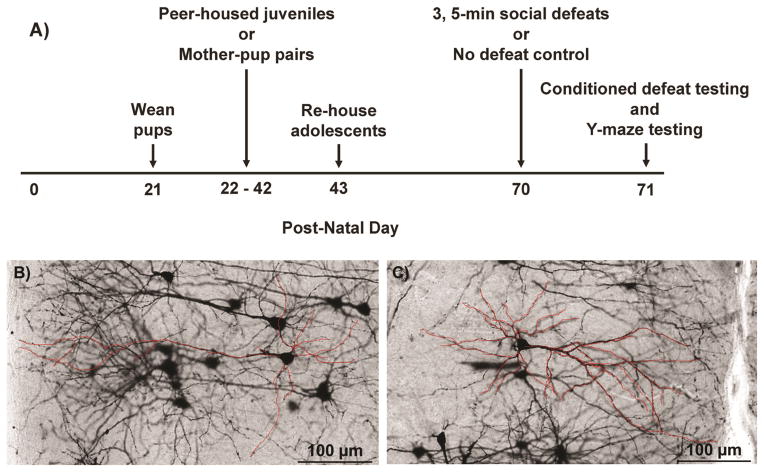
Figure 1.
Representations of the experimental design and dendritic quantification. A) Schematic diagram of the experimental timeline. B) Representative photomicrograph of Golgi-Cox staining in the IL cortex for a play-exposed animal. C) Representative photomicrograph of Golgi-Cox staining in the IL cortex for a play-deprived animal. The 2D tracing of select neurons is shown in red (online version only) and was performed using MCID image analysis software while simultaneously viewing 3D neurons on a microscope at 40x magnification.

