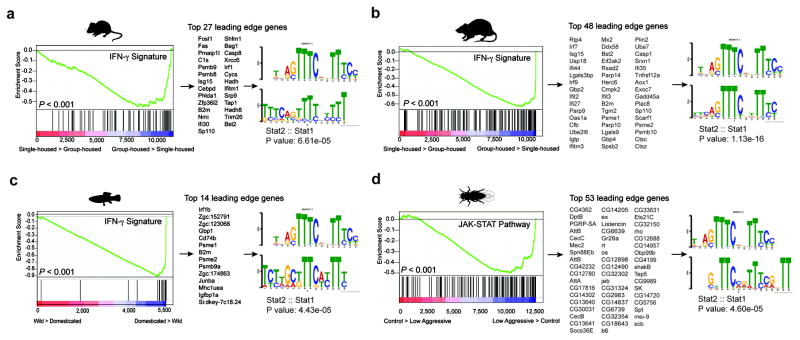
Figure 3. Over-representation of IFN-γ transcriptional signature genes in social behavior-associated brain transcriptomes of rat, mouse, zebrafish, and drosophila.
GSEA plots demonstrate the over-representation of IFN-γ transcriptional signatures (derived from Molecular Signature Database C2, GSE33057, or Lopez-Munoz, A. et al30) in brain transcriptomes of (a) mice and (b) rats subjected to social or isolated housing and in brain transcriptomes of (c) domesticated zebrafish compared to a wild zebrafish strain. (d) Over-representation of JAK/STAT pathway transcriptional signature genes (derived from GSE2828) in head transcriptomes of flies selected for low-aggressive behavior (behavioral readout for social behavior in flies (see methods section “Meta-data analysis” for more details)). Genes are ranked into an ordered list according to their differential expression. The middle part of the plot is a bar code demonstrating the distribution of genes in the IFN-γ transcriptional signature gene set against the ranked list of genes. The list on the right shows the top genes in the leading edge subset. Promoter regions of these genes were scanned for transcription factor binding site (TFBS) using MEME suite. MEME output demonstrates significant STAT TFBS enrichment in cis-regulatory regions of leading edge genes up-regulated in a social context.

