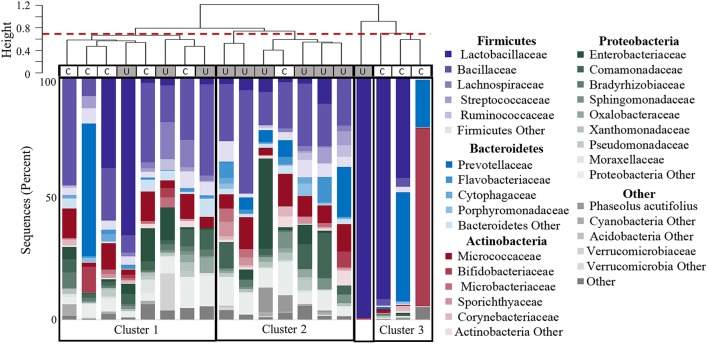
Figure 5.
Clustering of participants based on urinary microbiome profiles. The dendrogram (upper) is based on hierarchical clustering of the weighted Unifrac distances between the bacteria found in urine samples from controls (C) and women with UUI (U). The dashed line indicates where the clades were divided into three clusters: Cluster 1 which is comprised of five controls and three cases; Cluster 2 which is predominantly cases (six cases, one control), and Cluster 3 which is only controls. The sample type is indicated by the rectangle below the cluster bar: U, case; C, control. One case sample did not fall into a cluster at this level. The stacked bar plots below the heatmap represent the relative abundance of the bacterial families identified by 16S sequences present in each urine specimen. Bacterial families with an overall mean abundance < 0.5%, are grouped as “Other.” The main color is indicative of the bacterial phyla with the shade indicative of bacteria family.

