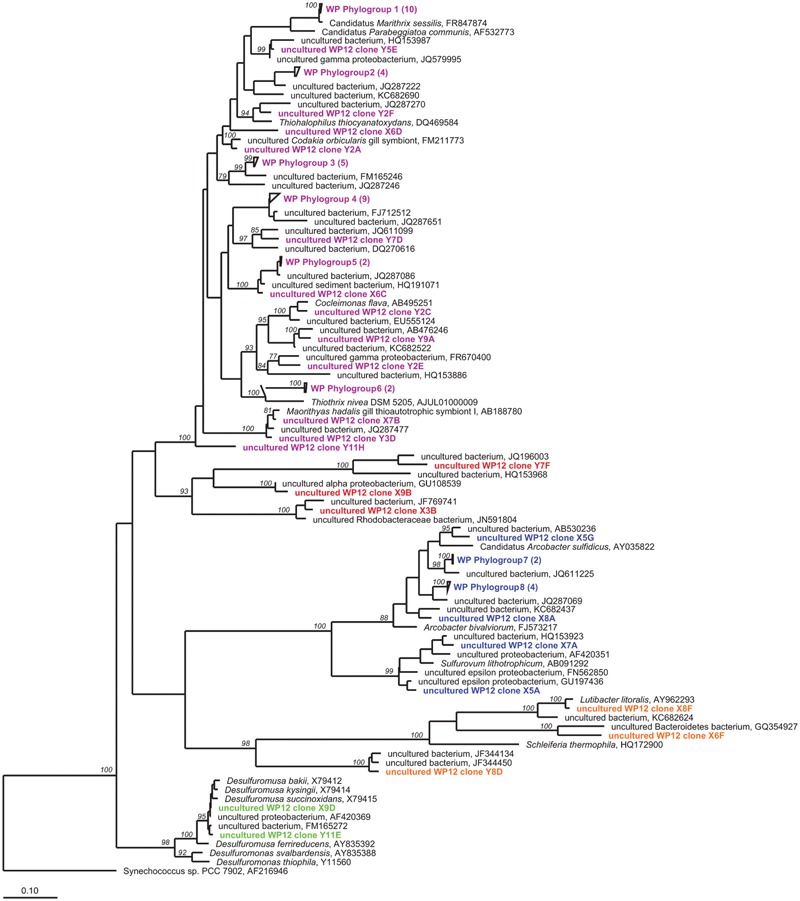
FIGURE 2.

Unrooted maximum-likelihood dendrogram of 16S rRNA gene sequences amplified from WP microbial mat community, aligned with closest relatives (black) using ARB software. Colors indicate WP taxonomic groupings. Purple, gammaproteobacteria; red, alphaproteobacteria; blue, epsilonproteobacteria; orange, bacteroidetes, and green, deltaproteobacteria. Wedges indicate redundant sequences with number of sequences indicated in parentheses. Values at nodes indicate >75% bootstrap support. Scale bar shows a 10% estimated difference in nucleotide sequence positions.
