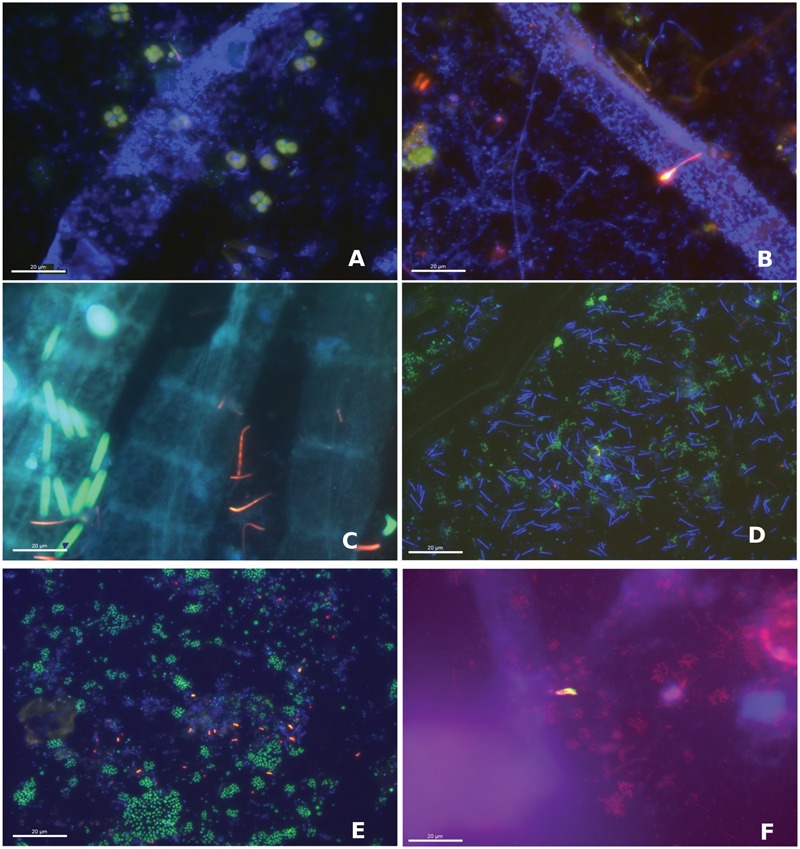
FIGURE 6.

Fluorescence in situ hybridization (FISH) images of the WP microbial mat community showing different fields of view from two colonized glass slides collected in June 2014 at 630X magnification. (A) Large filament (blue) showing DAPI signal and tetrads of Gammaproteobacteria (green). (B) DAPI-stained filaments (blue) and Gammaproteobacteria (green) with chains, rods and cocci Deltaproteobacteria (red; Delta495). (C) Large filaments (blue) with rod-shaped Gammaproteobacteria (green) and chains of Deltaproteobacteria (red; DSS658). (D) Groups of gammaproteobacterial cocci (green) with DAPI-stained filaments (blue). (E) Gammaproteobacterial cocci (green), deltaproteobacterial curved rods (red, DSS658) and DAPI- stained cocci and filaments (blue). (F) Aggregates of Deltaproteobacteria (yellow; DSS658) with Gammaproteobacteria (red) and DAPI-stained filaments (blue).
