FIGURE 8.

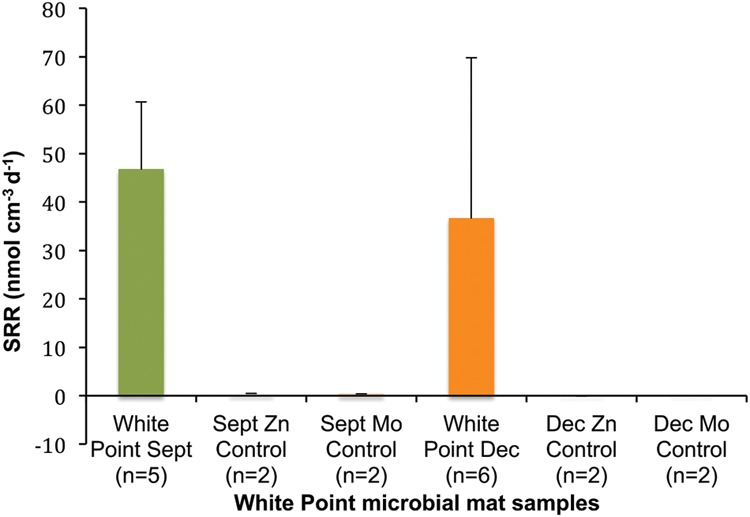
Mean SRR for WP microbial mat samples. Negative controls (Mo and kill) were always less than 1% of live rates (<1 nmol SO4 cm-3 day-1). Error bars = 1 SD.

Mean SRR for WP microbial mat samples. Negative controls (Mo and kill) were always less than 1% of live rates (<1 nmol SO4 cm-3 day-1). Error bars = 1 SD.