
Figure 1.
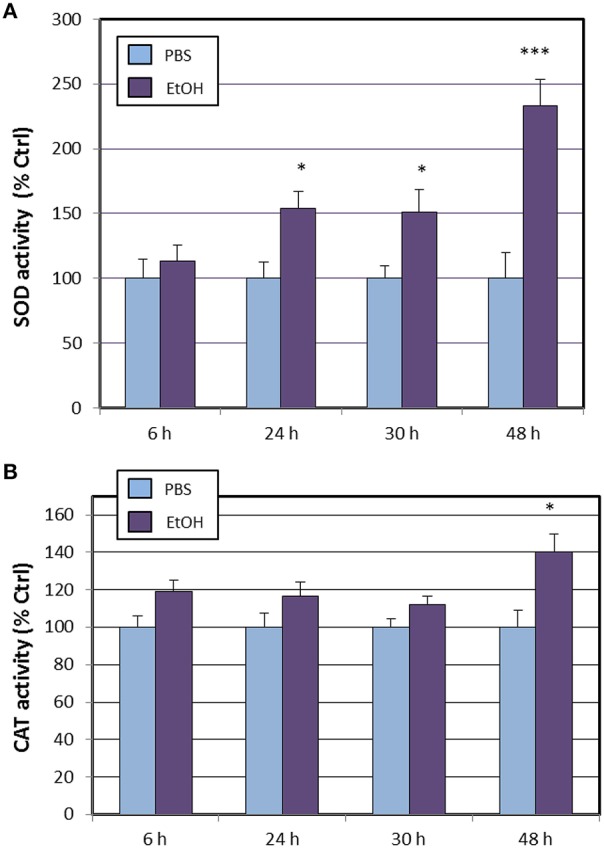
Effects of ethanol (EtOH, 0.1%) on total SOD (A) and catalase (B) activities in HT22 cells at different times after first exposure to ethanol. Results correspond to the mean ± SEM of four different experiments. *, and ***p < 0.05 and p < 0.005 compared to vehicle (PBS), respectively.