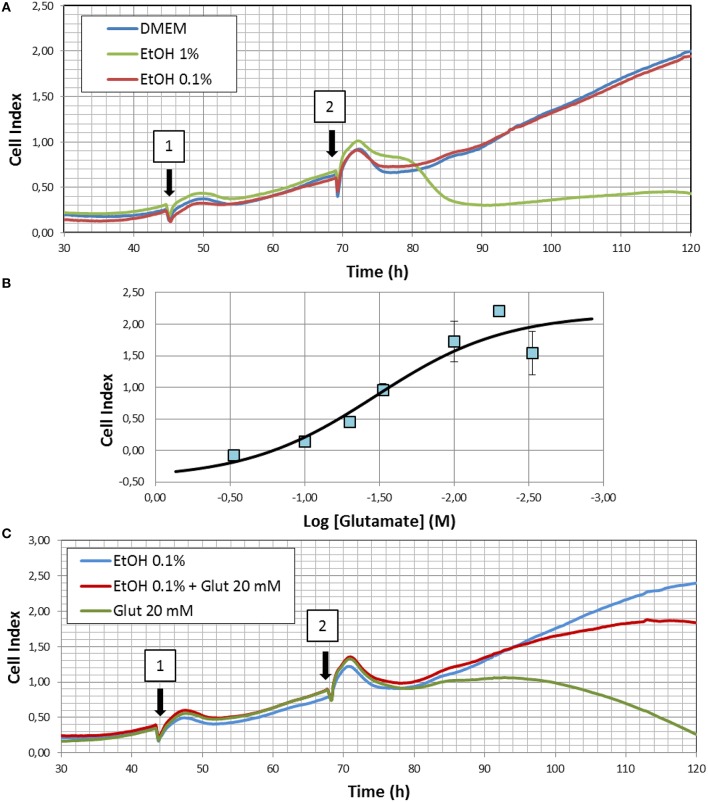
Figure 5.
(A) Representative experiment showing the effects of 0.1 and 1% ethanol (EtOH) on real time cell proliferation. Arrows indicate the time where media were replaced by either DMEM or EtOH 0.1% in 1 or DMEM, EtOH 0.1, or EtOH 1% in 2. (B) Dose-response curve for glutamate toxicity in HT22 cells. Results summarize data from three different experiments and are indicated as mean ± SEM. (C) Neuroprotective effects of 0.1% ethanol. Illustrated correspond to a representative experiment of glutamate excitotoxicity in the presence or absence of ethanol. Arrows indicate the time where cells were exposed to either DMEM, EtOH 0.1, or EtOH 0.1% + glutamate in 1, or EtOH 0.1%, EtOH 0.1% + glutamate, or glutamate alone in 2. Three different replicates were performed for experiments illustrated in (A,C).

