
Fig. 4.
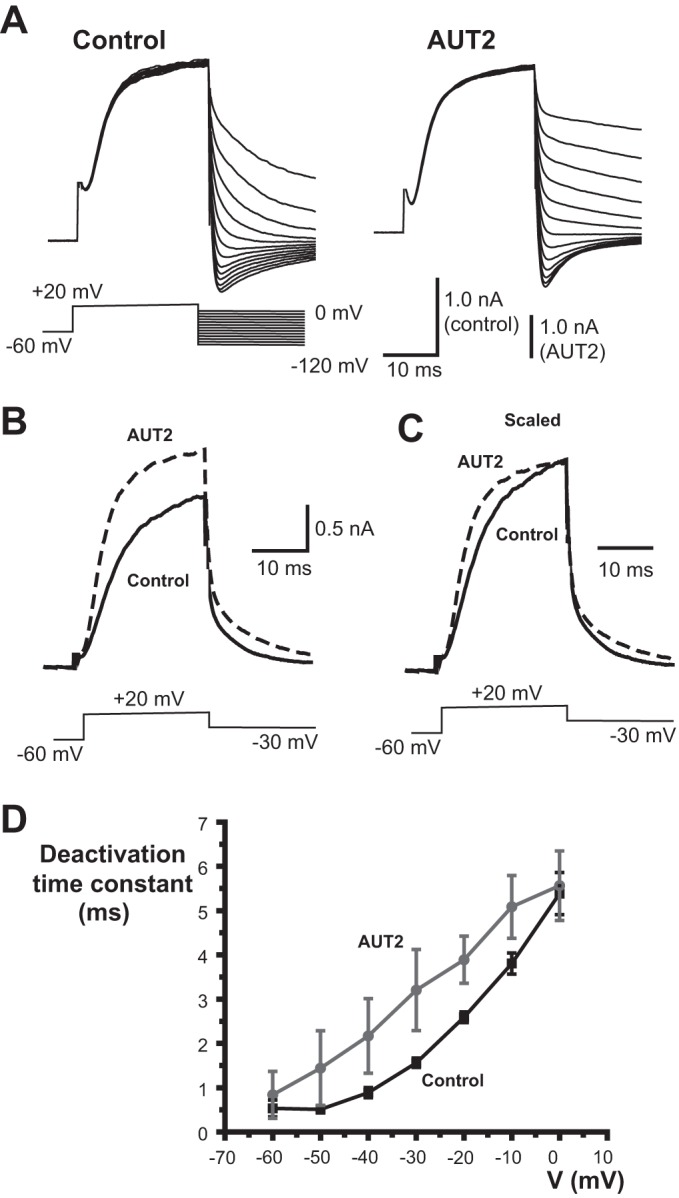
AUT2 slows the rate of deactivation of Kv3.1 currents. A: representative whole cell patch-clamp recordings of tail currents before and after application of 1 μM AUT2 recorded at potentials between −120 and 0 mV (in 10-mV increments) after a 20-ms pulse to +20 mV. B: superimposed traces from another cell showing the time course of activation at +20 mV and deactivation at −30 mV before and after 1 μM AUT2. C: same as B but with traces normalized to peak current at the end of the 20-ms activating pulse. D: plot of mean deactivation time constants before and after 1 μM AUT2 (means ± SE, n = 5). Recordings were carried out at 25°C.