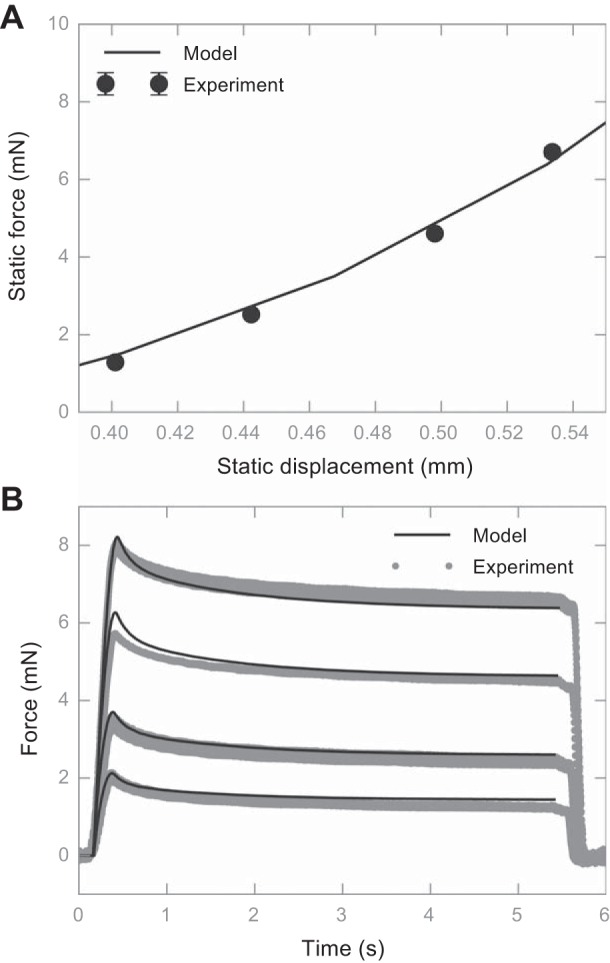
Fig. 3.

Comparison between the fitted FE model output and recorded force value during an electrophysiological experiment. A: static force vs. static displacement, where the line represents the model output, and the dots represent experiment measurements. Error bars are shown as SDs (not visible due to the low SD values). B: force traces vs. time. The solid line represents the model output, and the gray dots represent the aggregated experiment measurements. The animal used in this figure is an 8.3-wk-old female transgenic mouse expressing green fluorescent protein (GFP).
