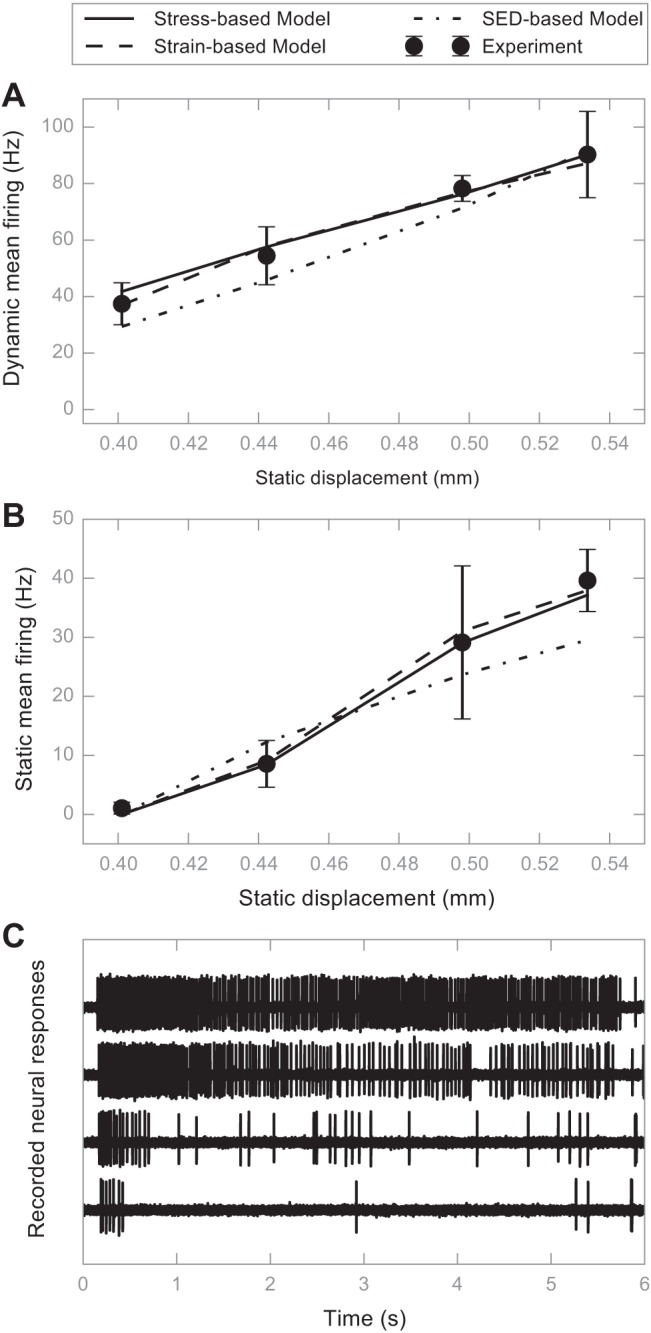
Fig. 4.

Results of fitting the neural submodel to an SAI afferent response. A: model prediction vs. experiment recording for dynamic mean firing rate. Predictions from the stress-based model are denoted with a solid line, those from the strain-based model are denoted with dashed lines, and those from the strain energy density (SED)-based model are shown with dotted-dash lines. Experiment recordings are solid dots with error bars denoting the SD. B: similar to A for static firing rate. C: representative neural responses at four displacements. The animal used in this figure is a female GFP transgenic mouse at 8.3 wk old. For this recording, there was a total of 14 stimulations and 2–4 stimulus presentations/displacement.
