Figure 3.
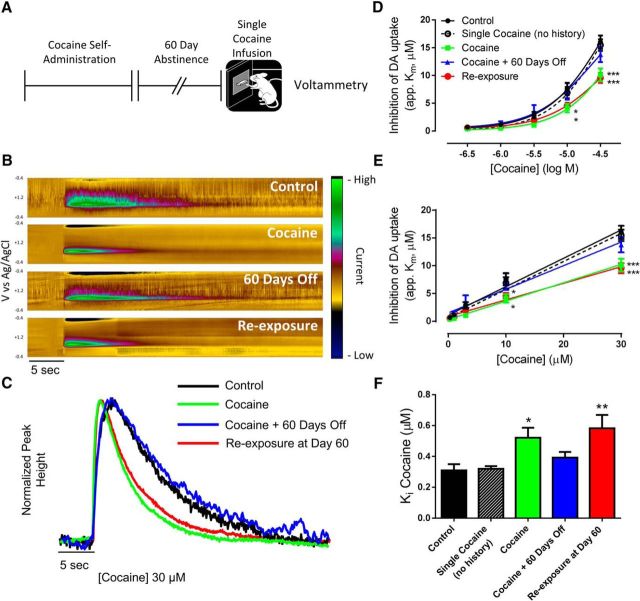
Cocaine self-administration leaves the DAT in a labile state following prolonged abstinence. A, Experimental timeline showing binge cocaine self-administration and subsequent cocaine re-exposure following a 60 d abstinence period. B, Dopamine (DA), as indicated by current (z-axis) occurring at its oxidation (+0.6 V) and reduction (−0.2 V) peaks (y-axis) across time (x-axis) is represented as pseudo-color plots and traces (C) following 30 μm cocaine. Logarithmic (D) and linear (E) cocaine concentration–response curves indicate tolerance to the uptake inhibiting effects of cocaine following cocaine self-administration, and this tolerance is reinstated by a single cocaine injection following a 60 d abstinence period. F, Ki values for cocaine are increased (ie, decreased cocaine potency) in the cocaine and re-exposure groups. *p < 0.05, **p < 0.01, ***p < 0.001 versus control. Control, n = 7; single injection, n = 4; cocaine, n = 6; cocaine + 60 days off, n = 6; re-exposure at Day 60, n = 6. Error bars indicate ± SEM.

