
Figure 2.
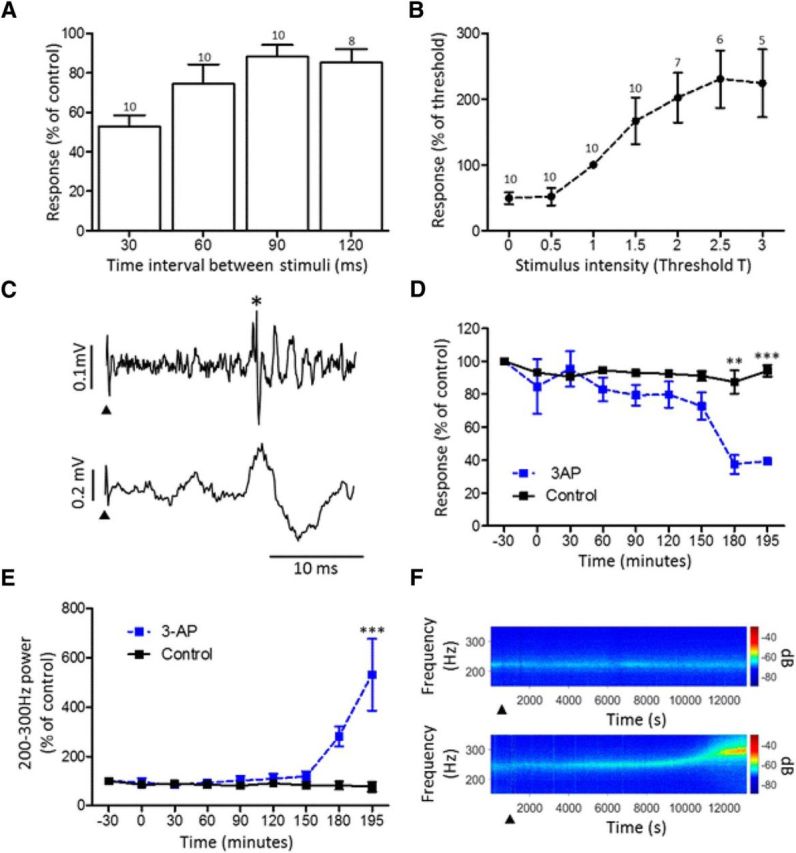
Characterization of evoked CFPs. A, Effect of paired pulse stimulation on the peak-to-peak amplitude of the second response expressed as a percentage of the first control response (mean ± SEM). Number of animals included in each mean shown above each bar. B, Stimulus–response curve for CFPs evoked by ipsilateral hindlimb stimulation at multiples of threshold for a detectable response (mean ± SD). Number of animals included in each mean shown above each data point. C, Example of a complex spike (top trace, asterisk) and CFP (bottom trace) evoked by the same ipsilateral hindlimb stimulation (arrowhead). D, Effect of 3-AP treatment on the amplitude of evoked fields (blue, n = 3) compared with saline controls (black, n = 2). Two-way ANOVA: interaction, F(8,27) = 3.36, p = 0.0084; drug, F(1,27) = 23.97, p < 0.0001; time, F(8,27) = 4.59, p = 0.0013. Bonferroni's post hoc tests comparing 3-AP with control at each time point, **p < 0.01, ***p < 0.001. Drug or saline administered at time 0. E, Effect of 3-AP treatment on 200–300 Hz power of LFP (blue, n = 3) compared with saline controls (black, n = 2). Two-way ANOVA: interaction, F(8,27) = 5.08, p = 0.0006; drug, F(1,27) = 13.30, p = 0.0011; time, F(8,27) = 4.55, p = 0.0013. Bonferroni's post hoc tests comparing 3-AP with control at each time point, ***p < 0.001. Drug or saline administered at time 0. F, Spectrograms derived from an example case (animal GRF) showing change in power in ∼200–300 Hz frequency bandwidth after application of 3-AP (bottom) in contrast to saline (top). Arrowhead, Time of delivery of saline or drug.