
Figure 3.
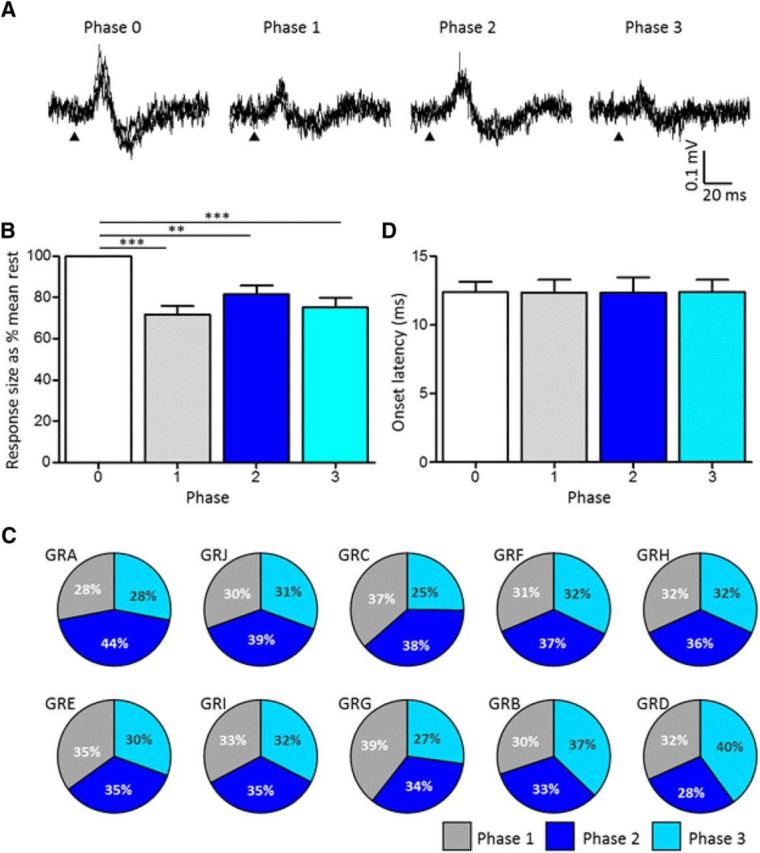
Changes in transmission in climbing fiber paths during rearing behavior. A, Example case (animal GRA) showing evoked CFPs during rest and three different phases of rearing (3 sweeps superimposed in each panel). Phase 0, Rest; phase 1, rearing up; phase 2, upright position; and phase 3, rearing down. Arrowhead indicates time of ipsilateral hindlimb stimulation. B, Bar graphs showing average size of evoked responses normalized to rest for the three phases of rearing (mean ± SEM; one-way ANOVA, F(3,39) = 11.14, p < 0.0001; Tukey's multiple comparison test, **p < 0.01, ***p < 0.001, n = 10 rats). C, Pie charts showing for each animal response size evoked during the three different phases of rearing expressed as a proportion of the total percentage change in response size relative to rest. Cases are shown in order of the largest to the smallest proportion in phase 2. D, Same as B but onset latency (mean ± SEM).