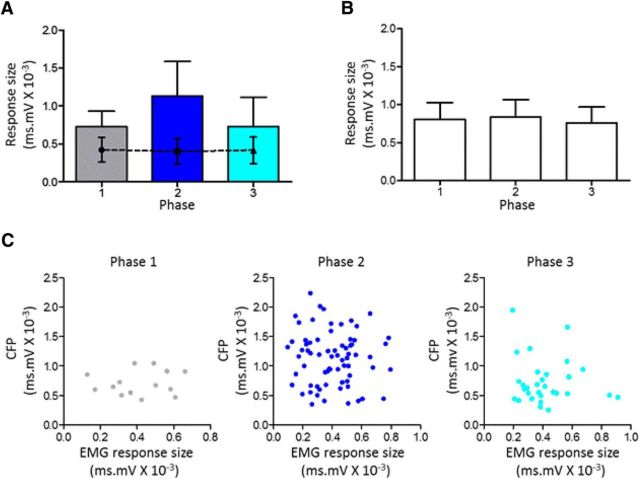
Figure 4.
Changes in evoked CFPs are not related to simultaneously evoked muscle reflex. A, Representative case (animal GRA) plotting for the three phases of rearing average size of CFP (bars) and EMG (dashed line) evoked by the same ipsilateral hindlimb stimulation (mean ± SEM in both plots). The phase-related variations in mean size of evoked CFPs were statistically significant (one-way ANOVA, p < 0.0001, F(2,112) = 13.41; Tukey's multiple comparisons test: phase 1 vs phase 2, p < 0.01 and phase 2 vs phase 3, p < 0.001). In contrast, the mean size of evoked EMG responses were not significantly different (one-way ANOVA, p = 0.877, F(2,112) = 13.19). B, Pooled data from six animals showing mean size of evoked EMG response relative to the three phases of rearing (mean ± SEM, one-way ANOVA, p = 0.971, F(2,15) = 0.0298). C, Scatter plots for one example case (animal GRA), showing trial-by-trial fluctuations in evoked CFP and EMG for the three phases of rearing (Pearson's correlation; phase 1, r = 0.156, p = 0.58; phase 2, r = −0.065, p = 0.59; phase 3, r = −0.113, p = 0.55).

