
Figure 5.
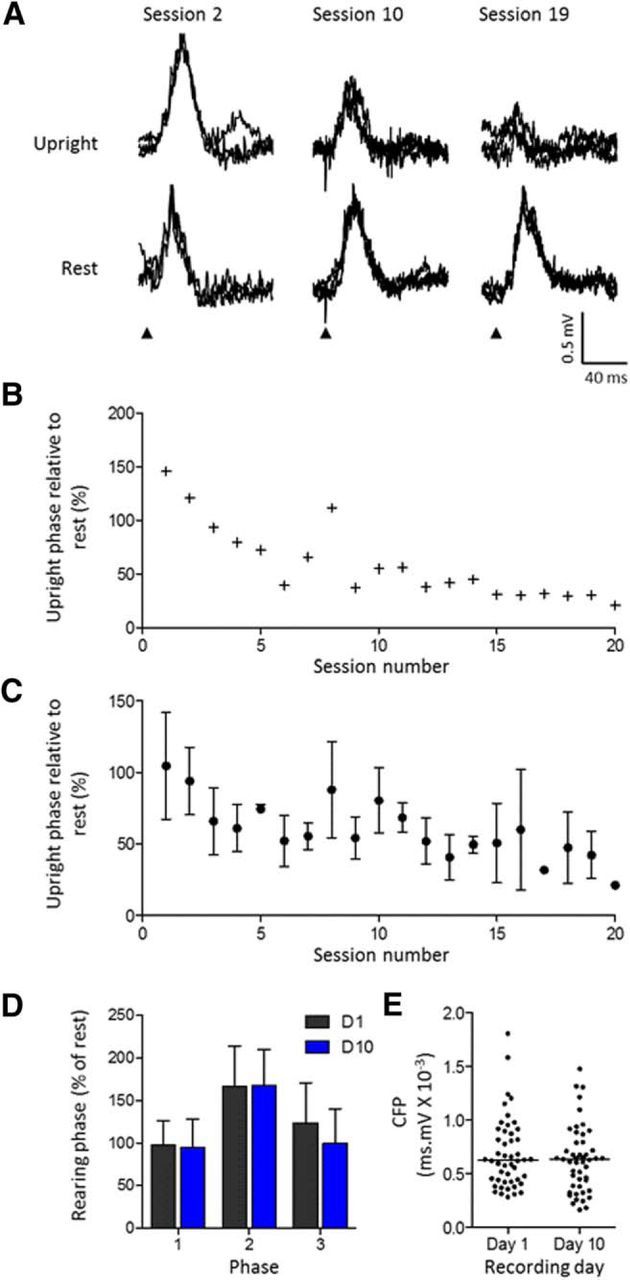
Changes in transmission as a stimulus becomes predictable. A, Example traces (3 sweeps superimposed) obtained from one case (animal GRJ) showing CFPs evoked during the upright phase of rearing (top row) and CFPs evoked in the same recording session but during rest (bottom row). Examples are taken from three different time points during training (from recording sessions 2, 10, and 19, on days 1, 5, and 10, respectively). B, For the same animal, mean size of evoked response relative to rest plotted as function of recording session number (Pearson's correlation, r = −0.828, p < 0.0001). C, Same as B but pooled data from three animals showing mean response size ± SD (Pearson's correlation, r = −0.770, p < 0.0001). D, Individual case showing mean size of evoked response expressed as a percentage of rest for the three phases of rearing for days 1 and 10 (D1 and D10). Same recording site on the 2 different days and responses evoked by pseudorandom presentation of the ipsilateral hindlimb stimulus (mean ± SD, two-way ANOVA interaction, F(2,192) = 0.86, p = 0.424; day, F(1,192) = 1.13, p = 0.289; phase, F(2,192) = 27.31, p < 0.0001). E, Distribution of size of individual responses evoked at the same recording site during rest on days 1 and 10 (unpaired t test, p = 0.286).