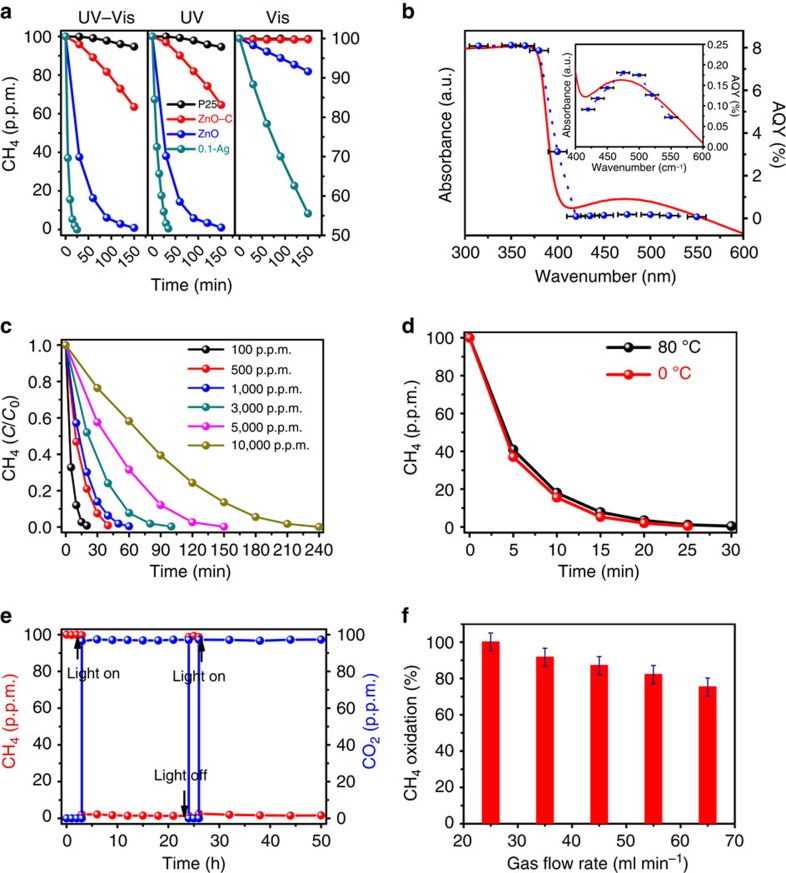
Figure 3. Photocatalytic oxidation of methane.
(a) Photocatalytic oxidation of methane in a fixed-bed mode with full arc (UV–vis), ultraviolet and visible light illumination, respectively. For comparison purposes, photo-activities of the commercial TiO2 (P25), commercial ZnO (ZnO-C) and as-fabricated ZnO under the same experimental conditions were shown as well. (b) Ultraviolet–visible diffuse reflectance spectrum and AQYs of the 0.1-Ag sample plotted as a function of wavelength of the incident light. AQYs were plotted at the centre wavelengths of the band-pass filters, with error bars showing the deviation of the centre wavelengths (Δλ=±12 nm). (c) Time evolution of the methane photo-oxidation over the 0.1-Ag sample in the fixed-bed mode under full arc illumination with various initial CH4 concentration. (d) Influence of the temperature on the methane photo-oxidation activities over the 0.1-Ag sample under full arc illumination. (e) Methane photo-oxidation activity over the 0.1-Ag sample under full arc illumination and a flow-gas mode with gas flow rate of 25 ml min−1. (f) Influence of the gas flow rate on the rate of methane oxidation under the flow-gas mode with ±5% error bars calculated from the sample introduction uncertainty.

