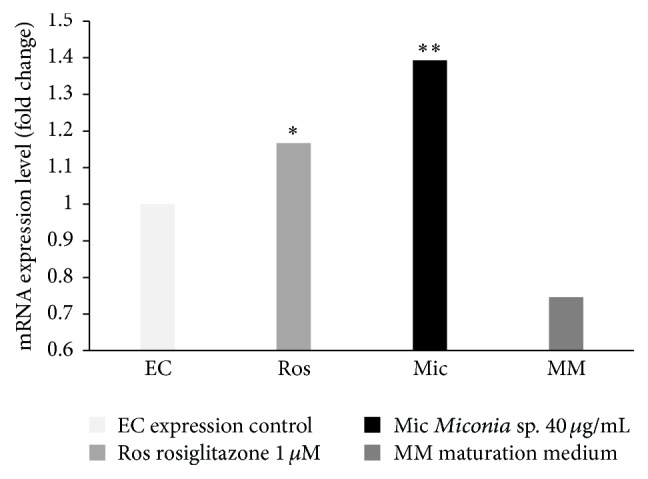
Figure 1.

Effect of different compounds on the expression of mRNA PPARγ. On day 10 the treatments were applied; Group 1: DMEM with 0.1% ethanol (EC), Group 2: MM and rosiglitazone (Ros) as a positive control, Group 3: MM and Miconia (Mic), and Group 4: MM. On day 11 of adipocyte differentiation the total RNA was isolated. ∗ P ≤ 0.05: there is a significant difference with the control of expression; ∗∗ P ≤ 0.05: there is a significant difference with the control of expression and rosiglitazone (n = 3).
