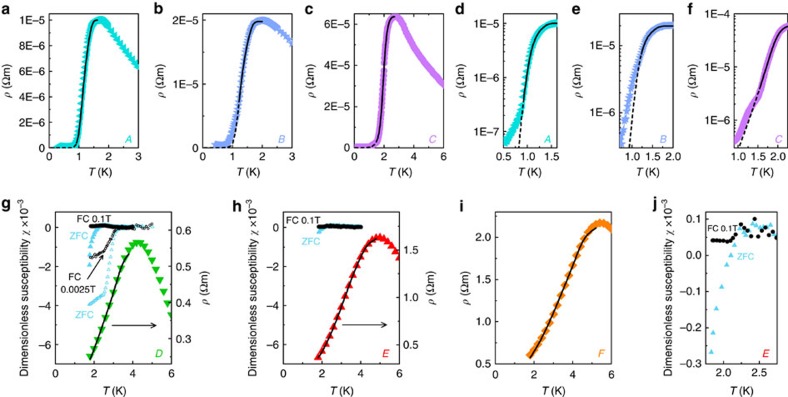
Figure 4. Resistive and magnetic superconducting transitions in Na2−δMo6Se6.
(a–c) Electrical resistivity ρ(T<6 K) for crystals A–C. Coloured points represent experimental data; black lines are fits to a 1D model incorporating thermal and quantum phase slips (Supplementary Note V). (d–f) Zoom views of ρ(T) in crystals A–C, plotted on a semi-logarithmic scale. The low-temperature limit of our 1D phase slip fits is signalled by a hump in ρ(T), highlighted by the transition from solid to dashed black fit lines: this corresponds to the onset of transverse phase coherence. In quasi-one-dimensional (q1D) superconductors, such humps form due to finite-size or current effects during dimensional crossover38. (g–i) ρ(T<6K) for the highly-disordered crystals D–F. Coloured points represent experimental data; black lines are fits to the same 1D phase slip model as in a–c, which accurately reproduces the broad superconducting transitions due to an increased quantum phase slip contribution (Supplementary Note V). Inhomogeneity and spatial fluctuations of the order parameter are expected to blur the characteristic hump in ρ(T) at dimensional crossover, thus explaining its absence from our data as the disorder rises. In g and h, we also plot zero-field-cooled/field-cooled (ZFC/FC) thermal hysteresis loops displaying the Meissner effect in the magnetic susceptibility χ(T); j shows a zoom view of the susceptibility in crystal E. Data were acquired with the magnetic field parallel to the crystal c-axis and a paramagnetic background has been subtracted. The small diamagnetic susceptibilities  are due to emergent pairing inhomogeneity creating isolated superconducting islands11;
  is further decreased by the large magnetic penetration depth perpendicular to the c-axis in q1D crystals.

