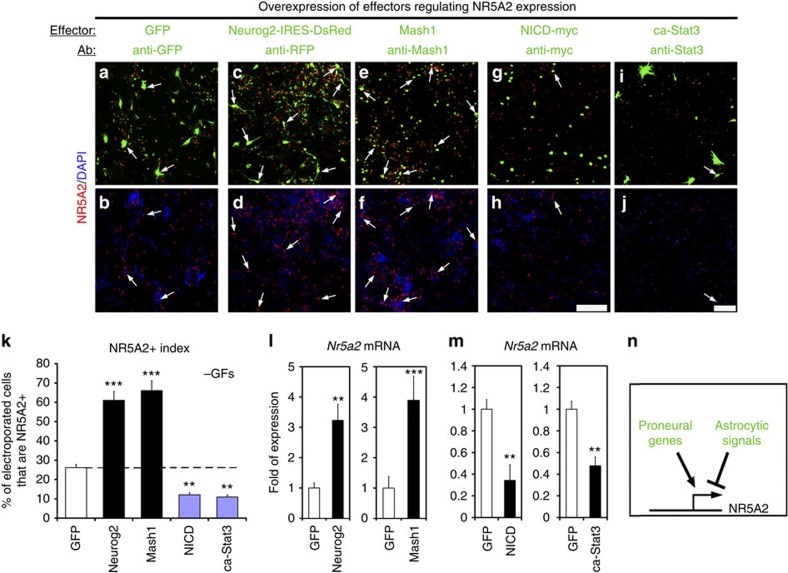
Figure 2. NR5A2 expression is regulated by proneural and astrogliogenic signals.
(a–j) Double GFP/NR5A2 (a,b), RFP (Neurog2, pseudo-colored green)/NR5A2 (c,d), Mash1/NR5A2 (e,f), Myc(NICD)/NR5A2 (g,h) or Stat3/NR5A2 (i,j) immunostainings of NSCs electroporated with various constructs, as indicated. Arrows mark representative cells that co-express the transgenes (green) and NR5A2 protein (red). Cell nuclei were visualized with DAPI staining (blue). (k) Quantification of electroporation data shown in a–j (% of transgene+; NR5A2+/total transgene+). (l,m) RT–qPCRs showing the quantification of Nr5a2 mRNA levels in differentiating NSCs, electroporated with GFP, Neurog2, Mash1, NICD-myc and ca-Stat3, as indicated. (n) Schematic representation of the upstream signals that regulate NR5A2. In every case, arrows indicate representative electroported cells that co-express each marker. The results are shown as mean±s.d. **P<0.01, ***P<0.001 (Student's t-test). Scale bars, 100 μm.

