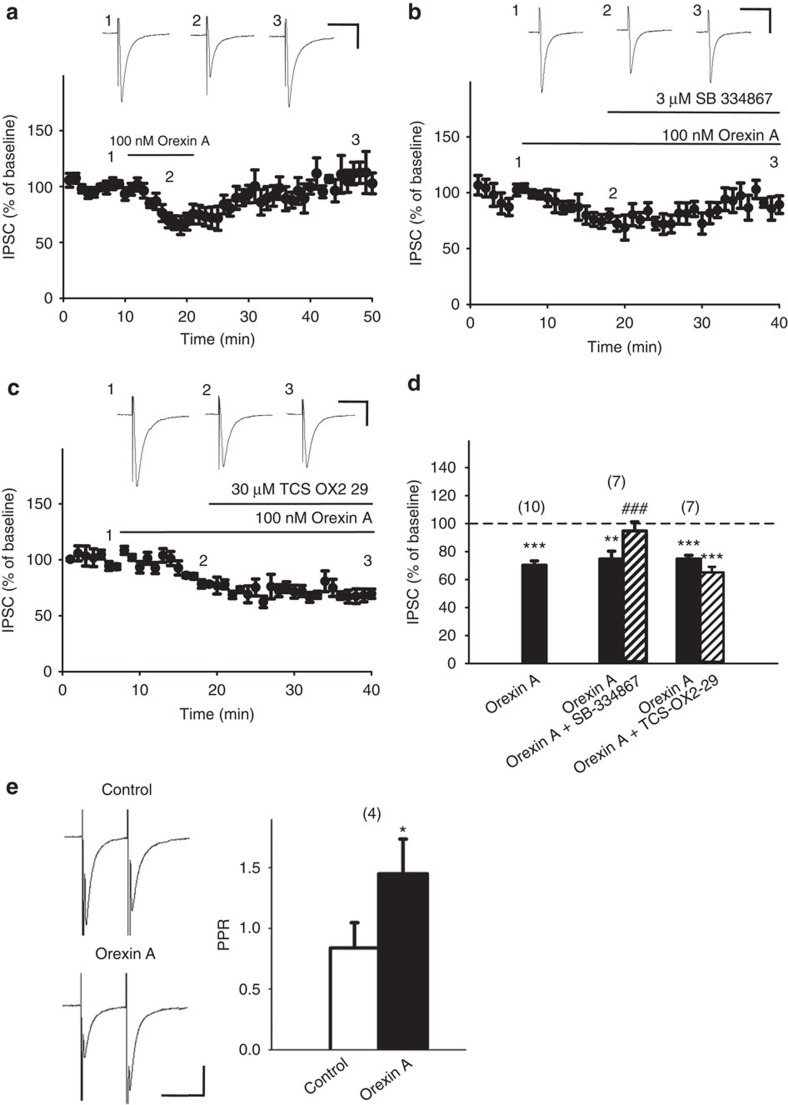
Figure 1. Orexin A depressed IPSCs in VTA slices through OX1Rs, but not OX2Rs, via a presynaptic mechanism.
(a–c) Time courses of the effects of orexin A on IPSC amplitude in representative slices (a) alone, or in combination (b) with SB-334867, an OX1R antagonist, or (c) with TCS-OX2-29, an OX2R antagonist. Inward IPSCs evoked at 0.05 Hz were recorded at −70 mV with a KCl-based internal solution in the presence of 2 mM kynurenic acid, and every three IPSCs were averaged. Shown are representative traces taken at the indicated time points. (d) Summarized effects of orexin A (100 nM) on IPSC amplitude without (black bars) or with 3 μM SB-334867 (n=7, P<0.001 ; t(6)=6.818) or 30 μM TCS-OX2-29 (n=7, P=0.0814; t(6)=2.091). Ten IPSCs at 10–15 min after drug application, when the response had stabilized, were averaged. The averaged amplitude of 10 IPSCs before drug treatment in each neuron was taken as 100% baseline. Data are presented as mean±s.e.m. The number of recorded neurons is denoted above each bar. Grouped bars represent the data from the same group with different treatments conducted sequentially. **P<0.01, ***P<0.001 versus 100% (one sample t-test); ###P<0.001 versus orexin A alone: n=10 (paired t-test). (e) The effect of orexin A (100 nM) on the PPR of IPSCs. Paired IPSCs were evoked by 50 ms-separated paired pulses every 20 s. Left panel: a representative paired IPSCs recorded in a neuron before and 10 min after orexin A treatment. Scale bars, 50 ms and 200 pA. Right panel: average PPR of IPSCs in four neurons recorded before (control) and after orexin A treatment. (n=4, P=0.026; t(3)=4.089). *P<0.05 versus control (paired t-test). Data are expressed as mean±s.e.m.

