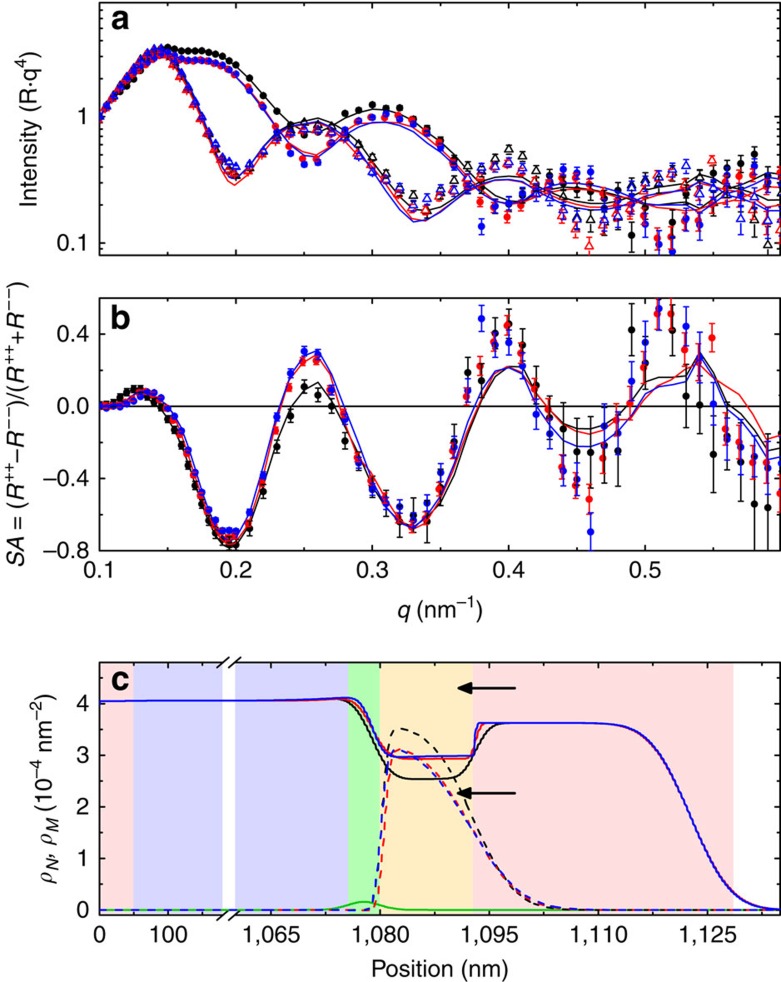
Figure 2. PNR results of thermally conditioned control sample.
(a) Fitted PNR data, with R++ (R− −) identified by solid circles (open triangles), scaled by q4 and (b) spin asymmetry for the sample as-grown and after thermal-only conditioning. (c) Depth-dependent nuclear and magnetic SLD, ρN and ρM, extracted from the PNR. In all panels black, red and blue lines identify the as-grown, once-treated (15 min) and twice-treated (2 × 15 min) samples, respectively. In c the solid and dashed lines identify ρN and ρM, respectively, and the green line identifies ρimag. Background colours in c represent (red) Pd, (purple) AlOx, (green) GdOx and (yellow) Co. In a and b the experimental data are shown as symbols, and the lines are fits corresponding to the depth profile shown in c. Error bars in a and b correspond to ±1 s.d. Arrows in a and b identify the bulk ρN for Co (2.25 × 10⁻⁴ nm−2) and CoO (4.29 × 10⁻⁴ nm−2).

